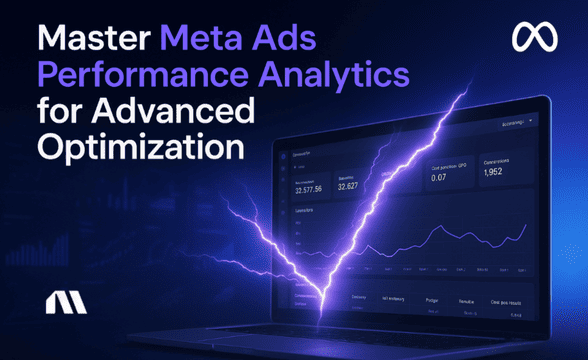
Think Your Ad Strategy Still Works in 2023?
Get the most comprehensive guide to building the exact workflow we use to drive kickass ROAS for our customers.


You're staring at your Meta Analytics dashboard at 2 AM, trying to figure out why Facebook says you made $10,000 in sales but your Shopify dashboard shows $7,500. Sound familiar?
We've all been there. One minute you're celebrating what looks like your best sales day ever, and the next you're questioning whether your tracking is broken or if you're missing something fundamental about how Meta reports data.
Here's the thing: Meta Analytics is Facebook's comprehensive analytics platform within Meta Business Suite that tracks performance across Facebook, Instagram, and WhatsApp ads. It provides insights into reach, engagement, conversions, and ROI for businesses advertising on Meta's family of apps. But understanding how to actually use it for e-commerce success? That's where most business owners get stuck.
The good news is that once you understand Meta Analytics – especially the attribution piece that's causing all that confusion – you'll have the insights needed to scale your store profitably. And trust me, it's not as complicated as it seems at 2 AM when you're second-guessing every number on your screen.
By the time you finish reading this, you'll know exactly how to:
Let's dive in and help you become proficient with Meta Analytics.
Think of Meta Analytics as your command center for understanding how your Facebook and Instagram ads are performing. It's not just another dashboard – it's Meta's way of showing you exactly where your ad dollars are going and what they're bringing back.
Here's what makes Meta Analytics different from other analytics tools you might be using: it tracks performance across Meta's entire family of apps (Facebook, Instagram, and WhatsApp) in one unified view. While Google Analytics shows you what happens on your website, Meta Analytics shows you what happens before people even get there.
The platform generated $162.4 billion in Family of Apps revenue in 2024. This means the data you're seeing represents insights from one of the world's largest advertising ecosystems. That's both powerful and overwhelming if you don't know what to focus on.
Pro Tip: Meta Analytics often shows different numbers than your e-commerce platform because it uses different attribution windows and tracking methods. This isn't a bug – it's actually showing you valuable data about your customer journey that your store analytics might miss.
The key is understanding that Meta Analytics excels at showing you the full customer journey across touchpoints. Your e-commerce platform focuses on final conversions. Both are important, but they're measuring different things.
Now that you understand what Meta Analytics does, let's talk about which numbers actually matter for your e-commerce business. There are dozens of metrics available, but focusing on the wrong ones is like trying to drive while staring at the speedometer instead of the road.
Impressions and Reach tell you how many people are seeing your ads and how many unique users you're reaching. For e-commerce, reach is often more valuable than impressions because you want to expand your customer base, not just show the same ad to the same people repeatedly.
Click-Through Rate (CTR) and Cost Per Mille (CPM) work together to show you how engaging your ads are and how much you're paying for that engagement. A good CTR for e-commerce typically ranges from 1-3%, but this varies significantly by industry and product type.
Here's something interesting: Instagram engagement rate averages 3.00% by reach in 2025, while Facebook typically sees lower engagement rates. This data helps you understand which platform might work better for your specific products.
Likes, comments, shares, and saves aren't just vanity metrics – they're early indicators of ad performance. High engagement often correlates with lower costs and better conversion rates down the line.
Return on Ad Spend (ROAS) and Cost Per Acquisition (CPA) are your north star metrics. ROAS shows you how much revenue you're generating for every dollar spent, while CPA tells you how much it costs to acquire a customer.
Purchases, cart additions, and initiate checkouts help you understand where people are dropping off in your funnel. If you're getting lots of cart additions but few purchases, you might have a checkout optimization problem rather than an advertising problem.
Quick Tip: Focus on 3-5 key metrics rather than trying to track everything. Most successful e-commerce stores monitor ROAS, CPA, CTR, and conversion rate as their primary KPIs.
For deeper insights into tracking these metrics effectively, check out our guide on Meta ads performance analytics which covers advanced tracking strategies.
Setting up Meta Analytics properly is like building a foundation for your house – get it wrong, and everything else becomes unstable. Let's walk through the setup process step by step.
Start by logging into Meta Business Suite using your business Facebook account. If you don't have a business account yet, you'll need to create one and verify your business information.
Once you're in, navigate to the "Analytics" section in the left sidebar. This is your Meta Analytics dashboard, and it might look overwhelming at first. Don't worry – we'll customize it to show only what matters for your e-commerce business.
For Shopify users (which covers most e-commerce stores), the integration is straightforward. Go to your Shopify admin panel, navigate to "Apps," and search for the official Facebook & Instagram app. Install it and follow the connection process.
This integration automatically sets up your Facebook Pixel and begins tracking basic events like page views, add to cart, and purchases. However, you'll want to verify that everything is working correctly using Facebook's Events Manager.
Your Facebook Pixel is crucial for accurate tracking, but with iOS 14.5+ changes, you'll also want to implement the Conversions API for server-side tracking. This combination gives you the most complete picture of your customer journey.
In Events Manager, verify that your pixel is firing correctly by testing a purchase on your own store. You should see the events appear in real-time within the Events Manager interface.
Now comes the fun part – customizing your dashboard to show the metrics that actually matter for your business. Click on "Customize" in your Meta Analytics dashboard and add widgets for:
Remove widgets that don't directly impact your e-commerce goals. A clean, focused dashboard is much more valuable than one cluttered with every available metric.
For more detailed setup guidance, our Facebook ads reporting tool article covers advanced dashboard configuration strategies.
Here's where things get interesting – and where most e-commerce owners get completely lost. Attribution windows are probably the single most important concept to understand if you want your Meta Analytics data to make sense.
Think of attribution windows as the "memory" of your tracking system. A 7-day click attribution window means that if someone clicks your ad today and purchases within the next 7 days, Meta will credit that sale to your ad campaign.
A 1-day view attribution window is more conservative – it only counts conversions that happen within 24 hours of someone seeing (not clicking) your ad. Most e-commerce businesses should use 7-day click attribution because customers often research before buying.
This is why your Meta Analytics numbers don't match your Shopify dashboard. Meta might be crediting sales to ads from several days ago, while Shopify only shows you when the actual purchase happened.
Neither is "wrong" – they're just measuring different things. Meta is showing you the full impact of your advertising across time, while Shopify is showing you daily sales totals.
For most e-commerce stores, 7-day click and 1-day view attribution works best. This captures the majority of your ad-influenced sales without being so broad that you're crediting ads for sales they didn't actually influence.
However, if you sell high-consideration products (like furniture or electronics), you might want to extend to 28-day attribution windows because customers take longer to decide.
Pro Tip: Different product types need different attribution settings. Fast-moving consumer goods work well with shorter windows (1-7 days), while luxury or high-ticket items often need longer windows (14-28 days) to capture the full customer journey.
Understanding attribution is crucial for accurate ROI measurement. For a deeper dive into attribution strategies, read our comprehensive Facebook ads attribution guide.
Let's address the elephant in the room – why your numbers never seem to match between platforms, and what you can actually do about it.
The most common culprit is attribution window differences. Your e-commerce platform typically uses last-click attribution (crediting the last thing someone clicked before buying), while Meta uses first-click or distributed attribution across multiple touchpoints.
Time zone differences also cause confusion. Meta might be reporting in Pacific Time while your store operates in Eastern Time, creating apparent discrepancies in daily totals.
Cookie blocking and ad blockers prevent some conversions from being tracked by Meta, but they still show up in your e-commerce platform when customers complete purchases.
Apple's iOS updates significantly reduced Meta's ability to track conversions, especially for mobile users. This means Meta Analytics might be under-reporting your actual results by 15-30% or more.
The solution isn't to abandon Meta Analytics – it's to implement server-side tracking through the Conversions API, which bypasses many iOS restrictions.
Server-side tracking sends conversion data directly from your server to Meta, rather than relying on browser-based pixels that can be blocked. This dramatically improves data accuracy and gives you more complete attribution reporting.
Most e-commerce platforms now offer built-in Conversions API integration, or you can use tools that specialize in server-side tracking implementation.
Quick Tip: When data doesn't match between platforms, trust your e-commerce platform for revenue totals and use Meta Analytics for understanding campaign performance and optimization opportunities. They're measuring different aspects of the same customer journey.
For businesses struggling with tracking accuracy, solutions like Madgicx's Cloud Tracking can help bridge the gap between Meta's data and your actual store performance.
Now that you understand the fundamentals and have your tracking set up correctly, let's talk about how to actually use Meta Analytics to improve your ROI. This is where the magic happens.
Meta Analytics provides incredibly detailed audience insights that most e-commerce owners completely ignore. In the "Audience" section, you can see demographics, interests, and behaviors of people who actually convert from your ads.
Look for patterns in your highest-value customers. Are they predominantly in certain age groups? Do they have specific interests? Are they more likely to be on mobile or desktop? Use these insights to refine your targeting and create lookalike audiences.
With Meta's Family of Apps reaching 3.35 billion daily active users, the audience insights you can gather represent one of the largest consumer behavior datasets in the world.
The "Creative" section in Meta Analytics shows you which ad formats, images, and copy variations perform best for your specific audience. Don't just look at CTR – focus on conversion rates and ROAS by creative.
You might discover that video ads have higher engagement but image ads drive more purchases, or that certain color schemes consistently outperform others. These insights are gold for scaling your creative production.
Use the attribution comparison feature to understand how different attribution windows affect your campaign performance. This helps you make better budget allocation decisions and avoid pausing campaigns that are actually profitable on longer attribution windows.
Look for campaigns that show strong performance on 7-day attribution but weak performance on 1-day attribution. These campaigns are building brand awareness and driving delayed conversions – valuable for long-term growth even if they don't look profitable in short-term reporting.
Meta Analytics lets you compare performance between Facebook and Instagram placements. Instagram has a 3.50% average reach rate while Facebook has 1.65%, but this doesn't necessarily mean Instagram will be more profitable for your specific products.
Test the same creative across both platforms and compare not just engagement rates, but actual conversion rates and customer lifetime value. You might find that Facebook drives higher-value customers even with lower engagement rates.
Pro Tip: Set up separate campaigns for each platform when possible, rather than using automatic placements, so you can better control budget allocation based on actual performance data.
For advanced optimization strategies, explore our guide on Meta ads performance scoring which covers sophisticated campaign evaluation techniques.
Even with perfect setup, you'll occasionally run into issues with Meta Analytics. Here are the most common problems and how to fix them quickly.
If conversions suddenly stop appearing in Meta Analytics, first check your pixel status in Events Manager. Look for any error messages or warnings about pixel implementation.
Verify that your Conversions API is still functioning correctly – server-side tracking can sometimes break after website updates or platform changes. Test a purchase on your own store and confirm it appears in Events Manager within a few minutes.
Check your attribution settings to make sure they haven't been accidentally changed. Sometimes platform updates reset attribution windows to default settings.
Meta Analytics can take 24-72 hours to fully attribute conversions, especially for longer attribution windows. Don't panic if yesterday's numbers look low – they'll likely increase as delayed attributions are processed.
For real-time decision making, focus on leading indicators like CTR, CPM, and immediate conversions rather than waiting for complete attribution data.
Use Facebook's Pixel Helper browser extension to verify that your pixel is firing correctly on all important pages. Common issues include missing pixel code on checkout confirmation pages or duplicate pixels causing data inflation.
If you're using Google Tag Manager, make sure your Facebook pixel triggers are set up correctly and aren't conflicting with other tracking codes.
Pro Tip: Set up Meta ads performance alerts to automatically notify you when tracking issues occur, rather than discovering problems days later when reviewing reports.
The key to troubleshooting is systematic testing. Change one thing at a time and verify the results before making additional changes.
One of Meta Analytics' most powerful features is the ability to create custom metrics that align with your specific business goals. This is where you can really differentiate your analysis from competitors who stick to standard metrics.
Create custom metrics like "Revenue per 1,000 Impressions" or "Average Order Value by Campaign" to get insights that standard metrics don't provide. These custom calculations help you understand the true efficiency of your advertising spend.
For subscription-based e-commerce businesses, consider creating metrics around customer lifetime value attribution or subscription conversion rates from different campaign types.
Use Meta Analytics' segmentation features to break down performance by customer type, product category, or purchase behavior. You might discover that new customers have different conversion patterns than returning customers, requiring different campaign strategies.
Segment by device type, geographic location, and time of day to identify optimization opportunities that aren't visible in aggregate data.
Pro Tip: Create weekly custom reports that automatically segment your most important metrics by your key business dimensions. This saves time and ensures you're consistently analyzing performance from multiple angles.
For detailed guidance on creating custom metrics, check out our Meta ads custom metrics article which covers advanced measurement strategies.
This is completely normal and happens because of attribution window differences. Meta Analytics uses 7-day click and 1-day view attribution by default, meaning it credits sales to ads from up to 7 days ago. Your Shopify dashboard shows sales by the date they occurred, not when the customer first saw your ad. Additionally, iOS 14.5+ privacy changes mean Meta can't track all conversions, so your actual sales might be 15-30% higher than what Meta reports.
For most e-commerce businesses, 7-day click and 1-day view attribution provides the best balance of accuracy and completeness. This captures the majority of ad-influenced purchases without being so broad that you're crediting ads for sales they didn't actually drive. However, if you sell high-consideration products like furniture or electronics, consider extending to 14 or 28-day windows since customers take longer to decide on expensive purchases.
Use Meta Analytics' platform comparison features to analyze performance differences between Facebook and Instagram. Focus on conversion rates and ROAS rather than just engagement metrics, since engagement doesn't always translate to sales. Set up separate campaigns for each platform when possible, rather than using automatic placements, so you can better control budget allocation based on actual performance data.
Sudden data changes usually happen because of iOS updates, changes to attribution settings, or pixel implementation issues. Check Events Manager for any error messages about your pixel or Conversions API. Also verify that your attribution window settings haven't been accidentally changed. Remember that Meta Analytics data can take 24-72 hours to fully populate, so recent data might appear incomplete.
Meta Analytics is excellent for understanding campaign performance and optimization opportunities, but it's best to use blended attribution for final ROI calculations. Combine Meta's data with your e-commerce platform data and any other marketing channels you're using. Meta Analytics tends to under-report conversions due to iOS privacy changes, so your actual ROI is likely higher than what Meta shows. Use Meta's data for optimization decisions and your e-commerce platform for revenue verification.
You now have the foundation to use Meta Analytics effectively for your e-commerce business. You understand how attribution windows work, why your numbers don't always match between platforms, and how to use Meta's insights to optimize your campaigns for better ROI.
The key is to start implementing these strategies systematically. Begin with fixing your attribution window settings this week, then move on to customizing your dashboard to focus on the metrics that actually drive your business forward.
Remember, understanding Meta Analytics manually is crucial for making informed decisions, but successful e-commerce brands also leverage AI-assisted optimization to scale faster. While you're building your analytics expertise, tools like Madgicx can provide AI-assisted campaign optimization based on the attribution data insights you're now equipped to understand.
The combination of your Meta Analytics knowledge and smart optimization tools is what separates growing e-commerce businesses from those that plateau. You've got the knowledge – now it's time to put it into action.
Ready to turn your Meta Analytics insights into optimized growth? Your competitors are already using these strategies to scale their businesses. The question is: will you join them, or will you keep manually analyzing data while they pull ahead?
Stop spending hours manually analyzing Meta data and optimizing campaigns. Madgicx's AI-powered optimization reduces manual Meta Analytics work and provides automated recommendations for ROI improvement - so you can focus on growing your business instead of managing ads.