Think Your Ad Strategy Still Works in 2023?
Get the most comprehensive guide to building the exact workflow we use to drive kickass ROAS for our customers.


Think of Facebook advertising as gardening; without the right information about the sun, water, and soil conditions, you’re planting seeds blindly and hoping to reap a bountiful harvest later.
Hint: it won't.
Facebook ads analytics provide the essential instructions for ensuring your campaigns grow and thrive. By leveraging them, advertisers can gain valuable insights into how their ads are performing, who they are reaching, and how to fix any issues that arise.
In this article, we'll explore how to navigate the Meta Ads Manager to find these analytics and highlight the ten key metrics you need to track to optimize your campaigns.
Without further ado, let's get ready to tend to our revenue garden!
Facebook ads analytics helps advertisers track, measure, and analyze their ad campaigns on the platform. It provides a treasure trove of data and insights that help you understand how your ads are performing, who they’re reaching, and how people interact with them.
Facebook supplies advertisers with access to these insights via its analytics tool, Meta Ads Manager, where we view and manage all aspects of our ad campaigns.
The Meta Ads Manager (previously the Facebook Ads Manager) is Facebook's built-in analytics tool to help us monitor and manage ad campaigns.
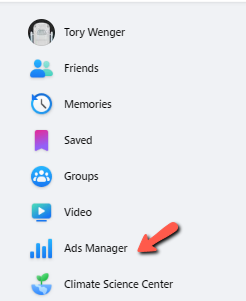
To get started, we need to head to Facebook and click Ads Manager on the left-hand navigation.
Here, you'll be brought to the Account Overview page. If you have any current campaigns (or issues with your account), you'll have them displayed here. For the purpose of the article, we will head over to the Campaigns view, which you can find on the left-hand side of the screen.

Finally, we're here! On this page, we can view our Facebook ads' performance broken down by campaign, ad set, and even ad level.

Facebook provides us with several layouts depending on what we'd like to advertise, which you can select using the columns button:

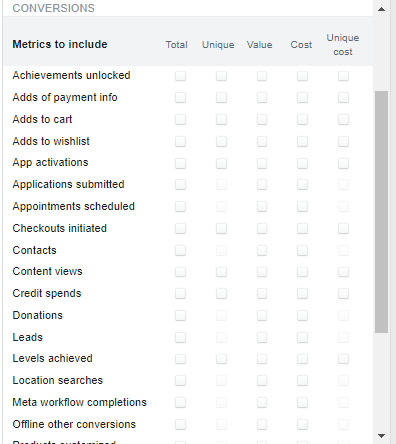
Another important feature is the customize columns button at the bottom of this pop-up. Often, I want a blend of metrics from all 3 of the standard reports so I don't need to toggle back and forth. In addition, specific metrics that aren't included in any of the default views can be added here.

P.S. We have a guide on every aspect of the Meta Ads Manager if you need more help with the tool.
As you've just seen, there's a lot to unpack inside the Meta Ads Manager. That being said, there are 10 key Facebook ads metrics that can determine whether your campaign will be a flop or a money-making machine.
To that end, let's break down what they are and how you can use them to improve your campaign performance!
First, we have reach, which is defined as the number of people who have viewed your ad. Specifically, Facebook looks at the Account Center accounts to determine the number of unique people who have viewed them. If a person has several accounts connected in the Account Center and views your ad on three accounts, your reach will still be one.
While reach may not be as attractive as other metrics like ROAS, it's more important than you think.
When you manage Facebook ads, over time, you'll find that your campaigns tend to convert around a certain percentage. When creating your budget, you typically look at your revenue goals and conversion rates and then see how many people you need to reach to achieve that goal, given your conversion rate. If you aren't reaching as many people as you need to, you'll fail to meet this goal.
The three most significant factors that go into your reach are your bid, budget, and targeting.
Since Facebook ad bidding is a giant auction house, those who bid the most are placed before their competitors. An excellent way to get around this issue is to put the maximum price you're willing to pay for that action.

For example, if you're an eCommerce marketer selling a $100 item, you might be willing to spend up to $10 for each conversion. If you set your bid values at this price, you'll have a higher chance of beating out lower bids for that audience. Facebook will only bid at the price needed to win the auction—so if your competitor is bidding $5, you'll only pay $5.01 to win.
Facebook reach is also impacted by things like the Customer Feedback Score and your ad quality. The solution to these problems is rather simple: make sure you're not creating spammy or unhelpful content or using dubious business practices.
Lastly, the audience targeting options you add also impact your reach. If your audience is broad (think everyone 25-45 in the USA who has a pet), chances are you'll have plenty of people in your targeting bucket. If you decide to go more narrow and target C-suite execs in manufacturing who live in a small city, chances are your bucket of available people will be smaller, and your reach will suffer.
When setting up your ads, you can get a live graph of your audience size, as well as estimated reach on the ad set page:

For best results, review your estimated reach to be sure it fits within your campaign goals. If it doesn't, you can increase your budget or edit your targeting options before you continue.
Facebook impressions are the total number of times your ad was seen. Here, Facebook counts every view, even if they were from the same person, as a separate impression. In the case of video, impressions are counted regardless of whether the video play button was clicked. Facebook also removes bot impressions from the count.
Just like reach, impressions can be used to ensure your campaign's success. If you see a high number of reach and impressions but not a lot of clicks, there's usually a misalignment between your ad and your target audience. Either the ad isn't engaging enough and needs a revamp, or the offer isn't compelling enough for that audience.
If you're seeing a high number of impressions and a low reach, your ad is being seen by the same people over and over, which may lead to ad fatigue. This means you may want to expand the number of people in your target base or switch out your creative for a fresh approach.
Most ads start delivering within 24 hours, so if you don't see any impressions after that, you'll want to check for delivery issues.
Everyone knows what a click is (or, at least, they think they do). In reality, the term click has several definitions in Zuckerberg's ad realm:
Link clicks are the typical 'click' definitions people think of and include:
Clicks (all) include all of the above, as well as:
and finally, outbound link clicks, which refer only to link clicks that take someone outside of Facebook entirely.

When determining performance, we'd recommend using link clicks or outbound clicks as your primary metric, as these clicks are more representative of your goals.
That being said, clicks are one of the most essential parts of analyzing your ads alongside your CTR (click-through rate). These two metrics are the primary indicators of how your audience reacts to your content. If these numbers are low, your ad needs to be refined through a graphic change, swapping the advertised offer, or changing your targeting setup.
CTR stands for click-through rate and is calculated as the number of clicks divided by the number of impressions, expressed as a percentage.

For many, the CTR can be more helpful than the number of clicks, as it factors in the number of impressions. 100 clicks can look like a lot of traffic, but when you compare that to 1 million impressions it's a bit less, well, impressive. In this regard, CTR helps put things in perspective when comparing the performance of your ad campaigns.
The average click-through rate for Facebook ads can vary from industry to industry, but the average for all hovers around 0.9%.
Conversion rate (abbreviated CVR) measures the percentage of users who take a desired action (conversion) after clicking on your ad. You can find your conversion rate by dividing the number of conversions by the number of clicks on the ad and then multiplying by 100 to get a percentage:

The term conversion here is vague for a reason—there are over a dozen actions (or conversions) that you can measure:
A conversion can be any desired action taken by the user after clicking on an ad, like making a purchase, signing up for a newsletter, or filling out a form.
If your ads are driving a ton of clicks but few conversions, it could be a sign that:
All of these issues require further debugging and troubleshooting; however, once done, they can have the most significant impact on overall performance.
Unless you're a niche philanthropist whose sole mission is to give Facebook as much money as possible, you'll likely also want to monitor your Facebook ad costs.
By tracking your ad spend (and conversion rates/ROAS), you can quickly spot which ads are hitting the mark and which ones are missing. This allows you to shift your budget to the ads that work best, which not only saves money but also gives you insights into what your audience actually likes.
Let's say you run a small online bookstore, and you've set aside $1,000 for Facebook ads this month. Halfway through the month, you see that the campaign promoting a popular new sci-fi release has already resulted in 30 sales, while the ad for a poetry collection has only led to 2 sales despite using up most of your budget.
You decide to shift more of your budget towards promoting the sci-fi book for the rest of the month. This switch maximizes your return on investment, boosting overall sales and ensuring your ad spend is used effectively.
CPM, or cost per mille, is the cost per 1,000 Facebook impressions (mille is the Latin term for one thousand).
By looking at the cost of the impressions and not just the total number of them, we can understand how much we are paying to have our ad seen. We can then factor this cost into our overall budget calculations to bid more effectively.
According to a study done by Databox, the average Facebook CPM in 2023 was $5.61.

CPC, or cost per click, is the average amount you pay each time your ad is clicked. Like the different types of clicks, this metric is also broken down into cost per link click, cost per click (all), and cost per outbound click.
Just like clicks and CTR, CPC is a direct indicator of your performance. A lower CPC usually indicates that the ad is performing well, attracting clicks at a lower cost (as long as the conversion rate matches). Conversely, a high CPC may suggest that the ad is not resonating with the target audience or that the competition for the ad space is high.

According to a study by Wordstream, the average CPC across all industries is $1.68.
The cost per conversion is the average amount spent to achieve a specific conversion. It is calculated by dividing the total campaign cost by the number of conversions.
Since conversions often represent our overall campaign goals (like purchases), monitoring conversion-based metrics is an absolute must. Knowing how much each conversion costs allows you to compare this against the revenue generated per conversion—without this, it's impossible to know if your campaigns are making you money or slowly bankrupting you over time.
If you haven't done so yet, you should set up your Facebook Pixel, which allows you to track conversions that happen outside of Facebook (aka your website). Due to limitations from the iOS 14 privacy updates, it's also recommended that you use the Conversions API to capture any missing data.
Return on Ad Spend (ROAS) is one of the 'north star' metrics for Facebook ads and is the revenue generated for every dollar spent on advertising. The main goal of this metric is to report on the profitability of your campaigns.
ROAS is calculated by dividing the revenue generated from the ad campaign by the total ad spend.

Imagine you manage an electronics eCommerce store, and you've spent $1,000 on a Facebook ad campaign. Throughout the campaign, you monitor sales and discover it has generated $5,000 in revenue.
To calculate the ROAS for this campaign, you divide the revenue by the ad spend:
ROAS = $5,000 (Revenue) / $1,000 (Amount Spent) = 5
This means that you earned five dollars in return for every dollar spent on the campaign.
Not only can you use this metric to make sure your campaigns are generating enough, but you can also use this to optimize your campaigns on a more granular level. A campaign with a high ROAS indicates alignment within your messaging, offer, and creative and your audience. This information can then be used to inform future campaign strategies.
As we saw above, Meta Ads Manager is filled with a vast amount of data. But navigating through the tedious tables and switching from tab to tab isn't the most efficient way to analyze your ad performance.
Enter in the One-Click Report.
Madgicx's One-Click Report revolutionizes ad analysis, making it easier and more efficient than ever. With this tool, you can view all the data you need to make informed decisions about your ad campaigns without having to switch back and forth between endless tabs.
In fact, you’ll find 19 templates (including specific templates for E-commerce and lead generation advertisers) pre-built for you, which include data from Meta, Google Ads, TikTok, Google Analytics, Shopify, and even Klaviyo.

For those busy advertisers, the Business Dashboard also allows you to view the same data across every ad account you manage all from one dashboard, including the other platforms mentioned above.

P.S. You can try out both of these features (as well as a goldmine of other Facebook advertising tools like the AI Marketer) for $0 during your 7-day free trial.
As we've learned today, mastering Facebook ads analytics is essential for any advertiser looking to maximize their campaign's effectiveness. By understanding how to navigate the Meta Ads Manager and focusing on the ten key metrics we outlined here today, you can gain valuable insights into your ad performance, refine your strategies, and achieve better results.
Stop wasting time analyzing metrics that don’t impact performance. Try Madgicx’s One-Click Report and get access to critical business metrics across Meta, Google Ads, Shopify, TikTok, Google Analytics, and Klaviyo at your fingertips.

Tory Wenger is a marketing operations whiz with 10+ years of experience mastering CRM optimization, digital marketing, and event strategy. A certified HubSpot, Facebook, and Google expert, her work has been spotlighted on top platforms like Hootsuite, AdEspresso, and Databox. When she’s not crafting winning strategies, you’ll find her gardening or painting in her home in the Florida panhandle.