The conversion metrics to track in Facebook ads, ranked by the decision they drive, plus the vanity numbers to ignore and picks by business type.
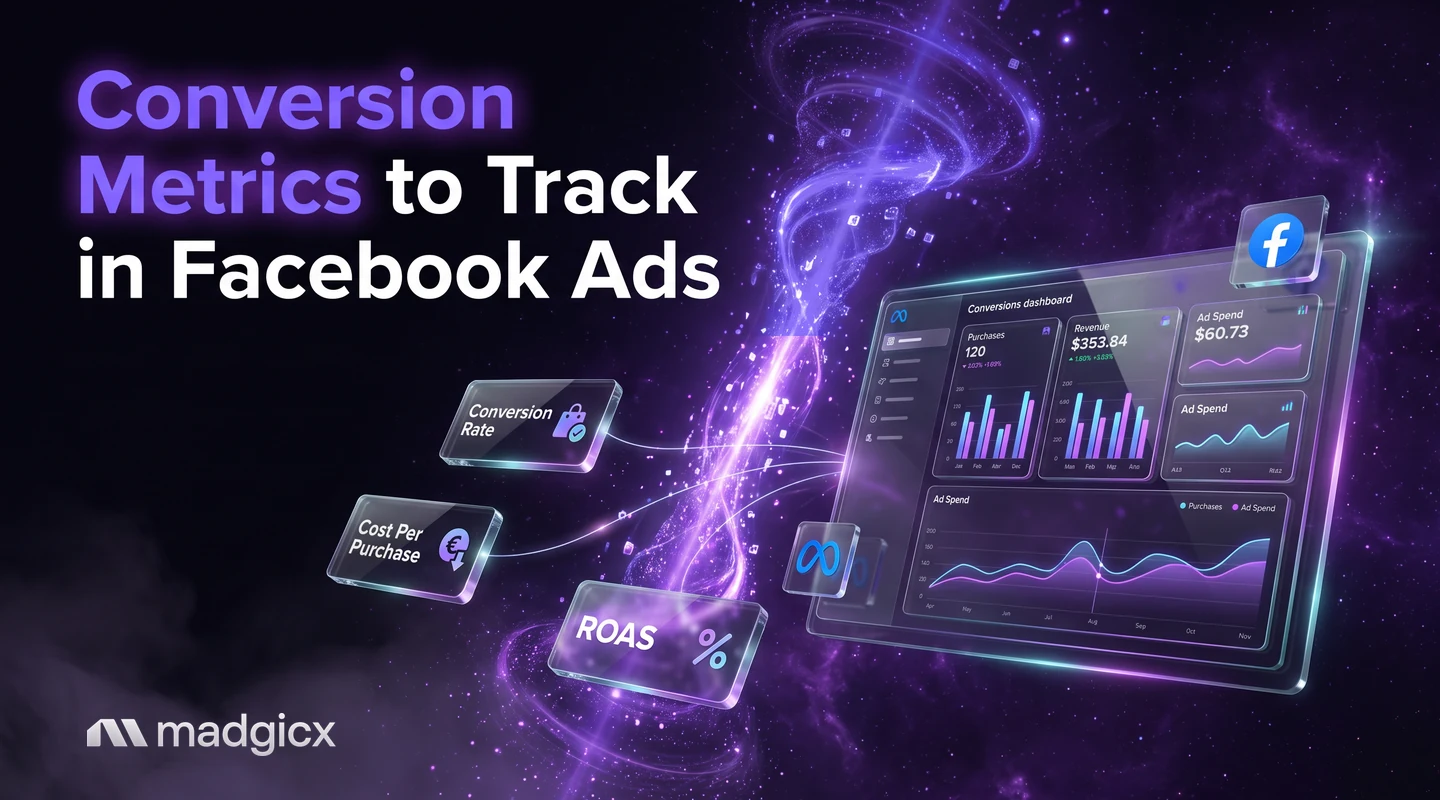
The conversion metrics worth tracking in Facebook ads are conversions, cost per result, ROAS, conversion rate, average order value (AOV), customer acquisition cost (CAC) and customer lifetime value. Start with the decision you need to make, then pick the one or two metrics that drive it, and ignore columns that do not change what you do next.
Before you read any of them, check that your tracking sends the conversions Meta needs. A clean metric on bad data is still wrong. This guide ranks the metrics by the decision each one drives, flags the ones that only look good, and shows which to pick for e-commerce, lead generation and app campaigns.
Send conversions from the server and check match quality in chat.
Start with the decision, not the dashboard
Ads Manager offers dozens of columns. Reading all of them leads to reacting to noise. Instead, ask which decision you are making this week, and look at the metric that answers it:
| Decision | Metric that answers it | What it tells you |
|---|---|---|
| Is this ad bringing in results? | Conversions | How many of the actions you want happened |
| Is it affordable? | Cost per result | What each conversion cost in ad spend |
| Is it profitable? | ROAS | Revenue returned for each dollar of ad spend |
| Is the page doing its job? | Conversion rate | The share of visitors who convert |
| Are customers worth more? | AOV, lifetime value | Revenue per order and per customer over time |
| Is the business growing? | CAC | What it costs to win one new customer |
Core metrics: conversions, cost per result, ROAS
Conversions
A conversion is an event you decided matters: a purchase, a lead, an app install. The count depends on your attribution setting. According to Meta's help page on attribution models and settings, standard attribution counts click-through events within 1 day or 7 days of a link click and view-through events within 1 day of an impression. Two ad sets with different settings can report different counts for the same behavior, so keep the setting the same when you compare.
Cost per result
Cost per result is ad spend divided by conversions. It is the quickest check on efficiency, but it does not tell you whether the result is worth the cost. A cheap lead that never buys is cheap and useless.
ROAS
Return on ad spend is revenue from ads divided by ad spend. If $1,000 of spend credits $3,500 of purchases, ROAS is 3.5. It ties spend to money, which is why most e-commerce decisions rest on it. Our guide to Facebook metrics explains the ad-level columns around it.
Quality metrics: conversion rate and AOV
These two explain why ROAS moves, so use them to diagnose, not to judge.
- Conversion rate is conversions divided by visitors (or clicks). A drop with steady traffic points at the page, the offer or the checkout, not the ad.
- Average order value is revenue divided by orders. A rise in AOV can lift ROAS with no change in conversions, for example after a bundle or a minimum order for shipping.
Read them together. A higher conversion rate with a lower AOV can leave revenue flat.
Business metrics: CAC and lifetime value
These move slower and answer whether growth is healthy.
- Customer acquisition cost (CAC) is total sales and marketing spend divided by new customers won. Unlike cost per result, it counts only new customers.
- Customer lifetime value (LTV) is the revenue, or profit, you expect from a customer over the whole relationship.
The useful read is the two together: if LTV is well above CAC, you can afford to spend more to win a customer, even when first-order ROAS looks thin. If it is not, scaling spend only scales losses. Our overview of marketing metrics covers more of the business-level view.
Metrics that look good but mislead
Some numbers are easy to improve and tell you little about revenue. Our glossary calls these vanity metrics. In Facebook ads, watch for these:
- Click-through rate on its own. Click counts use different definitions. In Madgicx's September 2026 Meta ads benchmarks, the overall median CTR counting all clicks is 2.97%, while the median link CTR is 1.53%. If you compare your all-click CTR with a link-click benchmark, you will think you are doing better than you are.
- Cost per click on its own. The same benchmark shows a median CPC (all) of $0.29 and a median link CPC of $0.53. Cheap clicks are not cheap customers.
- Reach, impressions and likes. They show exposure, not sales.
- Platform ROAS read against a different attribution setting. It can look strong because it counts views and the longer click window.
- Cost per lead without lead quality. A falling cost per lead can mean lower-quality leads.
The test for any metric is simple: if it improves, does revenue or profit improve? If not, treat it as a diagnostic, not a goal.
Which metrics by business type
| Business | Primary metric | Support metrics |
|---|---|---|
| E-commerce | ROAS, with cost per purchase | Conversion rate, AOV, CAC for new customers |
| Lead generation | Cost per qualified lead | Lead-to-sale rate from your CRM, CAC |
| App | Cost per install, then cost per in-app action | Retention, lifetime value |
| Subscription | CAC against LTV | Trial-to-paid rate, churn |
For lead generation and apps, the number that matters most usually lives outside Ads Manager, in a CRM or app analytics. Send it back to Meta where you can, so delivery optimizes toward the real goal. For more reporting views, see our list of social media metrics to track.
Check your tracking first
Before you trust any of the above, confirm Meta receives your events and can match them to people. Meta's best practices for the Conversions API say event match quality shows how effectively customer information parameters match events with a Meta account. Better event match quality can increase the additional conversions reported. Meta also advises sharing the same events through the Conversions API and the Pixel, deduplicating them, and aiming for a 75% event coverage ratio of Conversions API to Pixel events.
If your tracking misses sales, every metric above understates your results, and cost per result and ROAS look worse than they are.
Track conversion metrics with Madgicx
Madgicx helps on both sides of this. Madgicx Cloud Tracking hosts Meta's Conversions API Gateway and sends conversions to Meta from the server, so Meta sees and attributes more of them. Copilot checks your dataset quality and Event Match Quality in chat. And the Business Dashboard blends business metrics across channels, so ROAS sits next to the numbers that decide whether you grow.
FAQ
What are the most important conversion metrics for Facebook ads?
Conversions, cost per result and ROAS come first. Add conversion rate and AOV to explain changes, and CAC and lifetime value to judge growth.
What is a good conversion rate for Facebook ads?
It depends on your offer, price and audience, so compare against your own history first. Track it per offer, since a lead form and a purchase convert at very different rates.
What is the difference between cost per result and CAC?
Cost per result is ad spend divided by all conversions. CAC is total acquisition spend divided by new customers only, so it shows what growth really costs.
Why do my Facebook ad conversions differ from my store?
Meta credits conversions by its attribution settings and only counts events it receives. Your store counts every order, so the two rarely match exactly.
Which metrics are vanity metrics in Facebook ads?
Reach, impressions, likes, and click-through or cost per click read on their own. They show attention, not revenue.