

Think Your Ad Strategy Still Works in 2023?
Get the most comprehensive guide to building the exact workflow we use to drive kickass ROAS for our customers.


Tracking Facebook metrics is hard work—there’s an overwhelming amount of data coming at you all at once.
And knowing which ones matter is difficult because not all Facebook metrics are created equal. Vanity metrics feel good but don't translate into tangible business results.
So, we spoke to 30+ experts to help us zero in on the 20 most essential Facebook metrics.
Whether you want to increase brand awareness, drive engagement, generate leads, or boost sales, these metrics will help you track your progress and make data-informed decisions.
A quick note about how we narrowed it down to 20 metrics:
We surveyed 30+ industry thought leaders, including paid social specialists, marketing strategists, business owners, and 2 of our in-house experts.
These experts have years of experience with Facebook marketing and have seen firsthand which metrics make a real impact.
Based on their input and in-house experience, we chose these 20 essential Facebook metrics divided into five key categories:
Facebook post metrics help you understand how your content performs in terms of engagement, reach, impressions, and click-through rates.
“For businesses that would like to run campaigns that generate engagement, we would suggest you focus primarily on post engagements, video views, and post shares. This will allow you to see how engaged your audience is while building more exposure for your brand.”
— Kathryn Pearson, Head of PPC, The SEO Works
How to track these metrics: Insights for your Page's posts are available immediately after publishing. In the Insights section of your Page, you can track metrics like post reach and engagement. To see detailed insights, use the Meta Business Suite.

Engagement measures the total interactions on your post, including likes, comments, shares, and reactions. It tells you if your content is compelling.
While some experts we talked to called engagement a “vanity metric,” social media marketers still view engagement as a top metric for organic content.
Engagement rate = the % of people who interacted with your post out of the total number of people who saw it.
It's a far more accurate measure of how engaging your content is compared to raw engagement numbers.
“One of the most important Facebook metrics I recommend businesses track is engagement rate. This simple yet insightful metric measures the percentage of people who saw your content that liked, commented, or shared. A higher engagement rate means your audience finds your content impactful."
— Dustin Remy, Founder of FantasyJocks

Reach refers to the number of unique Facebook users who have seen your post.
Monitoring reach helps you understand how far your content has spread and informs your content distribution and promotion strategies.
“Reach measures the potential unique viewers of your content, directly indicating the extent of your brand's visibility and audience engagement."
— Nikola Baldikov, CEO and Founder at Inbound Blogging
Impressions refer to the total number of times your post was displayed, including repeat views. While reach focuses on unique Facebook users, impressions give you a sense of overall visibility.
BTW, check out our in-depth guide on Facebook impressions and why they matter.
Click-through rate measures the percentage of people who click on a link in your post after seeing it.
A high CTR suggests that your content is persuasive enough for your audience to take action — sign up to get your eBook, join a webinar, or purchase a product.
P.S. If your CTR is high but people are still dropping off before they convert, check for a mismatch between the post and the landing page you redirect them to. Any bait-and-switch tactics can kill your conversion rates.
Want to know how your brand is being perceived on Facebook? Track Facebook Page and brand awareness metrics to gain valuable insights into your audience's growth, demographics, and engagement with your brand.
But here’s a caveat:
“Shares and likes are great for building brand awareness, but they don’t necessarily translate to sales”
— James Wilkinson, the CEO and co-founder of Balance One Supplements
How to track these metrics: To view Page insights, switch to your desired Page from your profile photo and click “Insights” in the left menu.

Track your Page likes and followers over time to understand your audience growth and brand reach on Facebook.
This metric clearly shows how your community is expanding and can help you set more realistic growth targets.
Again, most experts consider this a vanity metric, but it can be a great way to experiment with your social media strategy. You can test copy, the best times to post, and CTAs and use these learnings to run ads.
“Referral Traffic measures the amount of traffic coming through to your website from Facebook, helping you evaluate if you should continue investing in the platform.”
— Giacomo Piva, Travel Industry Analyst and Co-founder at Radical Storage
You can see how Facebook contributes to your marketing funnel and overall business goals by analyzing referral traffic.

“Facebook provides robust tools for analyzing your target audience's demographics, interests, and behaviors. By leveraging these insights, you can refine your targeting strategy.”
— Matt Little, Director & Owner of Festoon House
Analyze the demographics of your Facebook Page followers, such as age, gender, and location, to tailor your content and offers to your target audience.
For example, suppose a skincare brand like Glossier discovers that a huge portion of its followers are young adults interested in sustainable beauty.
The brand can tailor its content to promote eco-friendly products, skincare routines using natural ingredients, and stories from influencers advocating for sustainable beauty practices.
Share of Voice (SOV) measures the percentage of total market conversations about your brand compared to competitors, reflecting your relative market presence. Brand Mentions, on the other hand, count the total instances where your brand is mentioned on Facebook, indicating direct engagement and awareness.
Track your brand's share of voice and mentions on Facebook relative to your competitors to gauge your brand's position and perception in the market.
This metric helps you understand how often your brand is being discussed and can provide insights into the sentiment surrounding those conversations.
For example, if you manage social media for a coffee brand like Starbucks, tracking the share of voice and mentions reveals frequent discussions about your brand.
If there's significant negative feedback about a new product, here's what you can do:
Facebook groups have emerged as powerful tools for building engaged, loyal communities around your brand. These groups provide a unique space for your audience to connect, share ideas, and interact with your business on a deeper level.
Tracking engagement, growth, and top contributors helps you learn how your group members interact with each other and your brand.
How to track these metrics: To access group insights, select your group and tap Manage. Then, scroll down to insights.

Engagement is a key metric for Facebook groups, as it reflects the level of interaction and participation among group members.
Tracking the number of posts, comments, and reactions within your group can help you gauge how active your community is.
Tip: Encourage members to share their experiences, ask questions, and provide feedback to keep the conversation flowing. More engagement within your Facebook group can lead to stronger relationships, increased brand loyalty, and valuable user-generated content.

Monitor the growth of your Facebook group over time to understand how effectively you are attracting new members and expanding your community.
Track the number of new member requests and the rate at which your group grows to identify trends and potential growth opportunities.
Tip: Consider implementing a strategic promotion plan to cross-promote your group on your other social media channels, website, and relevant online communities. Also, encourage current members to invite their friends and colleagues who may be interested in the topics your group covers.
Identify and engage with the top contributors in your Facebook group to build a sense of community and encourage ongoing participation. These key members are often your group's most active and influential voices.
Tip: Recognize and reward your top contributors to show appreciation for their efforts and encourage others to become more active in the group. Highlight their contributions, offer exclusive content or perks, or invite them to become group moderators or ambassadors.
As the TikTokification of all social media platforms continues and Facebook prioritizes video content in its algorithm, metrics like video views, engagement, and audience retention are key.
These metrics provide deep insights into how your videos are performing, how viewers are engaging with your content, and where there's room for improvement.
How to track these metrics: Performance insights help you track the performance of your videos shared on Facebook and across all your Facebook Pages.
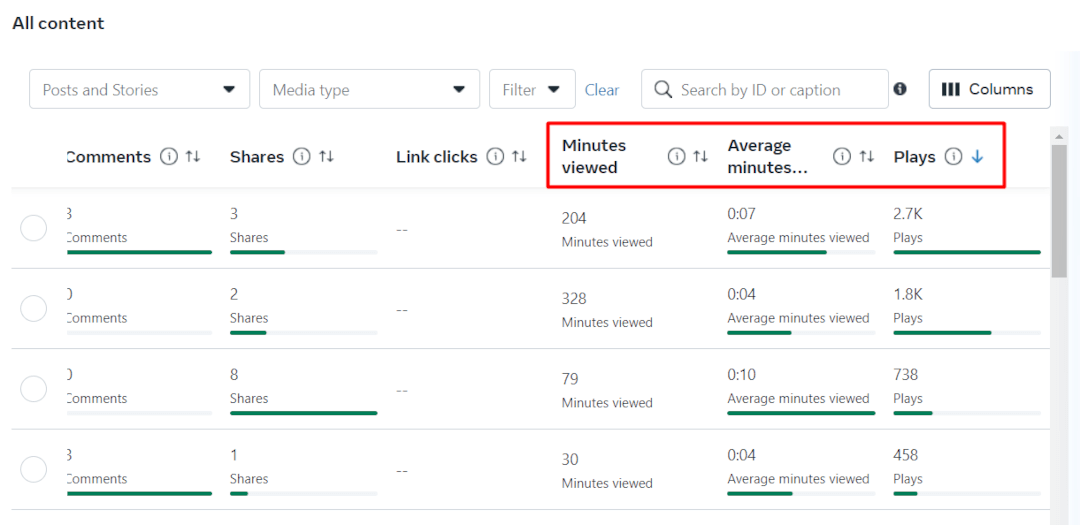
Go to Meta Business Suite > Insights > Videos > Performance to track video performance. Select the Page(s), date range, and post type to see insights like video views, minutes viewed, and top performers.
Video views are a fundamental metric that indicates the number of times your Facebook videos were watched.
This metric helps you estimate the overall reach and popularity of your videos.
Note: Facebook counts a view differently depending on the video format. For in-stream video ads, a view is counted after 2 seconds, while for organic videos, a view is counted after 3 seconds.
While video views provide a broad understanding of your reach, video engagement metrics offer a deeper look at how your audience interacts with your content. Engagement metrics include reactions, comments, and shares – all valuable indicators of how well your videos resonate with viewers.
A high level of engagement suggests that your video content is successful at capturing attention and has the potential to start meaningful interactions and drive your audience to take action.
Audience retention is a powerful metric that measures how long viewers are watching your videos before dropping off. This insight is crucial for understanding where your viewers are losing interest and identifying opportunities to improve your video content and structure.
Retention insights provide three key metrics:
Tip: Analyze your audience retention graphs to pinpoint the exact moments when viewership starts to decline and use that information to make strategic cuts, add engaging elements, or restructure your content to keep viewers hooked until the end.
Facebook ads are a powerful tool for driving targeted traffic, increasing brand awareness, and boosting conversions.
Tracking Facebook ad metrics gives you granular insights into how your ads are landing with your target audience, how efficiently you're spending your budget, and where optimization is needed.
"The primary metrics like ROAS, Ad Spend, Cost Per Purchase, AOV, Purchase Conversion Value, Number of Purchases, and Facebook Ads Conversion Rate should be the main focus when optimizing the ad account. These provide solid data for making optimization decisions.
Secondary metrics, such as Cost per Unique Link Click, Click-Through Rate (CTR), Cost Per Thousand Impressions (CPM), Frequency, Number of Adds to Cart, and Number of Initiate Checkouts, are supportive. These metrics should back up primary metrics but not be used alone for making optimization decisions. Always check primary metrics first."
— Santiago Michael Doyle, the Head of the Madgicx Agency
How to gather these insights: Besides using Meta Ads Manager, consider Madgicx’s One-Click Report to monitor Facebook metrics. It has a much simpler UI and templates that already contain the most important metrics, so you don’t have to spend time building reports from scratch.
And the best part? You can track cross-channel performance. Track Meta, Google ads, TikTok, Shopify, GA4, and Klaviyo in one live dashboard. Plus, you can easily share this data with clients and teammates for easy collaboration. Try it for FREE now!

Click-Through Rate (CTR) is a fundamental metric that measures the percentage of people who click on your ad after seeing it.
If your CTR is low, here’s some advice from Lina Bielskyte, Digital Advertising Specialist at Omnisend:
“Maybe your ad is not interesting to this specific audience, and maybe you need to adjust the targeting or test different creatives to improve results.”
A high CTR indicates that your ad creative and targeting are effective, resonating with your audience and encouraging them to take action.
But is there a benchmark? You bet. The average CTR across industries is 0.9%.

Here’s what Santiago from Madgicx has to say:
“A good CTR is usually above 1.3%, but you can still get very good performance of ROAS above a 4 even if you have a super low CTR at 0.3%. That’s why it’s always important to check the Primary Metrics of ROAS, Cost Per Purchase, and more before making an optimization decision just because the CTR is too low.”
Bottom line: Don’t look at these ad metrics in isolation.
Cost Per Click (CPC) represents the average amount you pay each time someone clicks on your Facebook ad.
Monitoring CPC helps you gauge the cost-efficiency of your ad spend and identify opportunities to optimize your targeting, creative, and bidding strategies for better returns.
What’s a good CPC? Glad you asked! The average Facebook CPC in May 2024 is $0.657.

According to Santiago: “A good CPC is usually below $2.5-$3 depending on the price point of the product (if it has a high price point, then you can afford a slightly higher CPC because competitors are willing to bid higher for acquiring customers because there are higher margins).”
Cost Per 1,000 Impressions (CPM) measures the average cost of 1,000 ad impressions.
This metric provides insights into how efficiently your ads are being delivered and how effectively you utilize your budget. A lower CPM generally indicates more cost-effective ad delivery.
The average Facebook CPM in May 2024 is $10.18.

According to Santiago, a good CPM is usually below $10 or $15 (depending on the product's price point.)
Cost Per Action (CPA) measures the average cost of achieving a desired action, such as a purchase, lead, or app install.
It's calculated by dividing your total ad spend by the number of “conversions” or desired actions.
The average CPA across industries is $18.68.

And how can you keep your CPA low? Iterative testing and optimization:
“Experiment with different ad formats, visuals, and messaging to see what resonates most with your target audience. Refine your targeting to ensure that your ads are seen by individuals most likely to convert while adjusting your bidding strategies to maximize ad visibility without overspending.”
— Tristan Harris, Demand Generation Senior Marketing Manager, Thrive Digital Marketing Agency
Return on Ad Spend (ROAS) is a crucial metric that measures the revenue generated for each dollar spent on Facebook ads. A higher ROAS indicates stronger financial returns and a more profitable ad campaign.
For eCommerce, the median ROAS, according to Databox, is 2.25, while other industries see a much lower ROAS.

Our in-house expert’s benchmark: “It depends on the breakeven ROAS, but usually, a decent ROAS is above at least 2.2. In most cases, a "good" ROAS is above 3 because most brands have low profit margins, so they only make a decent profit above 3 ROAS.”
But is ROAS the best metric? Some claim that the marketing efficiency ratio (MER), which measures sales revenue divided by total marketing spend, might be a better metric to assess your ads’ efficiency. Read our article to learn more about it.
Stop drowning in data! Madgicx’s One-Click Report makes tracking Meta ads, Shopify, TikTok, Google ads, GA4, and Klaviyo effortless. With just one click, you can access live data, set goals, and generate detailed reports.

Sneh is a freelance B2B content marketing manager who routinely writes about paid social, online advertising, and CRO for eCommerce. When she’s not online, she's spending time with her dogs or experiencing existential dread listening to Radiohead.


