Think Your Ad Strategy Still Works in 2023?
Get the most comprehensive guide to building the exact workflow we use to drive kickass ROAS for our customers.


Understanding which key metrics to monitor can sometimes feel overwhelming when navigating paid ads or cultivating organic social media growth. Every like, click, and email makes a huge difference for digital marketing teams striving for online success, and tracking the right marketing metrics is where it starts.
This guide breaks it down into manageable pieces, helping you understand and connect with your audience. Dive in, and let's make these insights get you on the right track, support your business goals, and help you capture more market share.
Whether using Google Ads or running paid social media campaigns, these are the most important metrics — a marketer's wingmen.
The cost-per-click metric tells you how much you pay each time someone clicks on your ad. It’s a key indicator of how efficiently you utilize your ad budget. When you achieve a lower CPC, you get more clicks for less money, often signifying that your ads are well-targeted and resonate with your audience.
For example, if you're running a campaign for a product, a low CPC might mean you're reaching people who are genuinely interested in similar products, increasing the likelihood of turning them into qualified leads. A lower CPC combined with a higher percentage of qualified leads means you're attracting web traffic and the right traffic that is more likely to convert into customers.
This formula is how you would calculate your CPC:

Wordstream says the average CPC on Facebook is around $1.72, but this figure differs drastically depending on your industry. Instagram's CPC as of June 2024 is $1.09.
On TikTok, you can pay about $1 per click, and on Google Ads, the average cost per click last year was $4.22. Check out our article on Google Ads versus Facebook ads for a deeper comparison.

Unlike other platforms, YouTube ads operate on a pricing model different from CPC. Instead of charging per click, YouTube charges advertisers based on cost per view (CPV) or cost per action (CPA). For instance, if a viewer clicks on or interacts with the thumbnail video, advertisers are charged according to CPV or CPA rates, typically $0.10-$0.30.
Click-through rate is the percentage of people who click on your ad after seeing it. A high CTR indicates that your ad sits well with the audience, making it more likely to convert viewers into new customers. Monitoring CTR helps you understand which ads are performing well and which need improvement, allowing for continuous optimization of your campaigns.
This is how you calculate it:

While a good CTR can vary significantly by industry and platform, here’s a breakdown of typical CTRs across different advertising platforms:
For Google Ads, the average CTR across all industries is about 3.17% on the Search Network and 0.46% on the Display Network. The average click-through rate for Facebook ads is around 0.90%. Typically, Instagram feed ads achieve CTRs ranging from 0.22% to 0.88%, whereas IG Story ads show a narrower CTR range of 0.33% to 0.54%.

The average click-through rate on TikTok varies by ad format. TopView ads, which appear right when users open the app, typically achieve an impressive CTR of 12% to 16%. Brand Takeover ads follow with a CTR of 7% to 10%. In-feed ads, which blend into a user’s TikTok feed, have the lowest CTR, ranging from 1.5% to 3%, due to the competition with other feed content.
Regarding YouTube ads, you can expect an average CTR of about 0.65%, lower than other social media platforms. It is likely because YouTube users are primarily there to watch videos, so ads often feel like interruptions, resulting in lower clicks.
This metric measures the percentage of clicks that result in a desired action, like a purchase or sign-up. For any marketer, it provides crucial data about the effectiveness of your digital marketing campaigns by indicating how well your ads are driving meaningful interactions with your audience and generating qualified leads.
Optimizing your ads to drive more conversions can reduce customer acquisition costs (CAC), as you spend less to get the same or better results.
The formula goes like this:

The conversion rate for Facebook ads averages a high of 9.21%. The success varies based on ad content relevance, audience targeting precision, and campaign objectives.
Instagram's conversion rates lag behind those of Facebook. According to Bazaarvoice, even top-performing brands on Instagram typically achieve a modest 1% conversion rate. This disparity may be influenced by users primarily using Instagram for entertainment, which affects their engagement with advertising content and makes them less likely to respond to ads.
.png)
Regarding Google ads, we typically see an average conversion rate of 4.40% on the Search Network, whereas on the Display Network, the average sinks to 0.57%. Below, you can see the exact average for your specific industry.
TikTok's average conversion rates tend to sit at around 1.1%. The typical conversion rate for e-commerce YouTube Ads ranges from 0.05% to 0.5%. However, if your objective is to generate new leads, aim for a conversion rate between 40-60%.
ROAS is the revenue generated for every dollar spent on your ads. A higher ROAS means your ads are more profitable and efficiently converting, which directly ties into maximizing the value of your ad budget. Additionally, your customer acquisition cost (CAC) tends to decrease when you optimize for conversions. This means you’re spending less to acquire each customer, which is a win-win for your ad budget and long-term profitability.
Calculating your return on ad spend formula is pretty simple:

When your return on ad spend is at least 1, you're at least breaking even on your advertising costs. In other words, you’re generating enough revenue to cover what you’re spending on ads. On the flip side, a ROAS below 1 means you're losing money.
Aiming for a ROAS between 3-5 is a good benchmark. That means that for every dollar you spend on advertising, you’re earning three to five dollars in revenue, which many businesses consider a solid digital marketing performance.
But what exactly is a good ROAS? The definition can vary significantly depending on your industry, business type, and size. It’s best to compare your ROAS against industry averages to understand where you stand.
Impressions measure the number of times your ad appears on a user's screen. Whether users notice the ad or not, every time it shows up counts as an impression. While impressions might not be as critical as some other ad metrics, they offer valuable insights into how widely your ad or social media content is circulating and your potential to engage viewers and drive conversions.
While impressions are valuable for understanding how widely your ad circulates, they can also fall into the category of vanity metrics if not tied to actionable goals like clicks or conversions. A high impression count might look impressive, but without engagement or ROI, it doesn't always translate to meaningful results.
You also can't discuss impressions without mentioning cost per mille (CPM), which advertisers pay for every 1,000 ad impressions. Your CPM can significantly influence your ad expenses and budget allocation. A higher budget typically results in more impressions, while a lower budget may limit your reach.
On average, you can expect to pay $7.19 per 1000 Facebook impressions. Regarding cost per mille, Instagram impressions are slightly higher than Facebook's costs at $7.91 per 1,000 impressions. When it comes to Google Ads costs, most businesses are spending $0.51 – $1000 per 1000 impressions on average in 2024. A study found that the average TikTok CPM for video ads was $12.85.
.png)
On YouTube, an impression counts when at least half of a video thumbnail is visible to potential viewers for over one second. Tubebuddy reports that YouTube's CPM varied between $13.03 and $15.34 per 1,000 views in 2023.
⚠️ Impression share is another metric you may want to consider, as it shows the percentage of available impressions your ad has captured in a given market. A higher impression share indicates you're securing a more significant portion of the available impressions, which is crucial for increasing visibility and engagement.
As a savvy marketer, these metrics are key to optimizing your marketing efforts if you want to build a loyal following without spending a dime.
It is your golden engagement metric for organic growth. It shows how much your audience connects with your content through likes, comments, shares, and saves. Focusing on creating content that sparks conversations and resonates emotionally tends to drive higher engagement.
When you see a spike in likes or thoughtful comments, it's a good sign that you're hitting the mark with your audience. This is how you calculate it:

It's not just about the numbers—it's about attracting the right followers who genuinely care about what you share. Consistency in posting content that aligns with your brand’s values and interests keeps the follower count ticking upwards steadily. If you notice sudden drops, it might be worth evaluating if recent content aligns with your audience's expectations.
This metric tells you how many unique users have seen your posts. To boost reach organically, focus on using relevant hashtags, engaging with trending topics, and encouraging shares. When your reach expands, it opens up new opportunities to connect with potential followers who might become loyal fans.
Reach is calculated like this:

Email might be old-school, but for digital marketers, it’s still a powerhouse for marketing efforts. Here’s what you need to track.
What's the point of sending out emails if you don't know whether anyone's opening them? The open rate is essential—it reveals the percentage of recipients who open your email. It’s like a window into how effectively your subject lines grab attention.
By tracking open rates, you can assess which subject lines resonate best, experiment with different approaches, and refine your content to boost engagement.
What’s a good email open rate? That will vary based on factors like industry, target audience, and the specific type of emails you send. However, as a general guideline, benchmarks for email open rates are as follows:
An average open rate of 15% -25% across industries is considered decent. Achieving an open rate above 25% is excellent and indicates strong engagement with your audience. On the other hand, a low open rate below 15% suggests there may be opportunities for improvement in your email snippets and subject lines or audience-targeting marketing strategies.
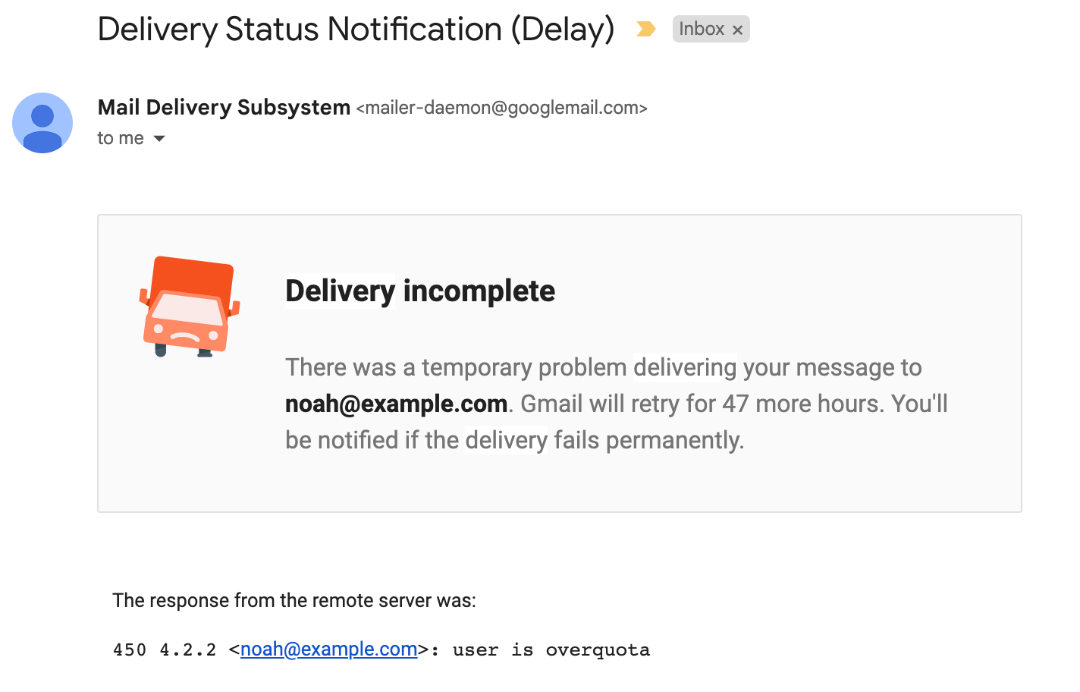
Ah, the dreaded email from the daemon of bounced emails. Sound familiar?
The bounce rate in email marketing refers to the percentage of emails that couldn’t be delivered to recipients' inboxes. There are two types of email bounces. This email example is what we call a soft bounce 👇
Below is what we call a hard bounce 👇

It’s the final boss of email delivery failures. These bad boys pack a punch—they're permanent and can seriously dent your sender reputation and email deliverability. They happen when you have invalid email addresses or landed on someone’s email blocklist.
Unlike their softer counterpart, hard bounces don’t get a second chance; mail servers throw in the towel after one failed attempt.
An acceptable benchmark for bounced emails is 2% or below. If your bounce rate lingers between 2% and 5%, consider it an amber light, signaling caution. However, once your bounce rate surpasses 5%, it’s a glaring red alert. By monitoring bounce rates, you can identify and rectify issues promptly.
The unsubscribe rate tells you the percentage of recipients opting out of your email list after receiving a campaign. It's like gauging how well your emails resonate with your audience. Keeping an eye on this metric helps you tweak your email content, frequency, and relevance to better suit their preferences. Monitoring unsubscribe rates closely ensures your emails aren't becoming a nuisance to current and potential customers.

🛎️ Similarly to Google Ads and social media advertising platforms, CTR and conversion rate are also critical metrics to track in email marketing. CTR indicates the percentage of email recipients who clicked on a link or call to action, reflecting the relevance and appeal of your email content. The conversion rate measures the percentage of recipients completing a desired action after clicking through, such as purchasing or signing up.
Your website is your digital storefront. Keep it in top shape with these metrics:
This metric directly affects your site's visibility and how effectively your brand awareness marketing strategies draw in new customers. Monitoring web traffic trends helps you understand where your audience is coming from, which channels are performing best, and where you might need to optimize to attract even more website visitors.
How long do visitors stick around? Longer stays mean they're loving your vibe. For B2C companies, a decent average session duration is around 92.33 seconds.
So, ensure your landing page is intriguing enough to reel them in, and the rest of your content keeps them hooked. Give your website visitors the surf sesh they dream of 🤙
As we already said, you've got to give your visitors a reason to dive deeper. Pages per session is all about enticing visitors to explore more of your site. More pages viewed per visit suggest they dig what they see. You can even suggest related content like this to keep them exploring.

The average number of page views per session across all industries is 5, with the grocery sector leading the pack with an impressive average of 7 page views per session. That is unsurprising because shoppers browse multiple product categories, compare prices, and explore various deals and promotions.

This metric tracks how many website visitors find you through search engines without paid ads. It's your SEO report card—optimize your keywords, boost content relevance, and refine your SEO marketing plan to climb the search rankings and dominate search engines.

Why is organic traffic so important? It's a long-term play—you won't have to keep throwing cash at paid campaigns.
🛎️ Just like in email marketing, monitoring the conversion rate is crucial for website and SEO metrics. In GA4, you used to be able to monitor the bounce rate as well; however, the traditional 'bounce rate' isn’t directly trackable anymore. Instead, you monitor the bounce rate using the engagement rate metric.
Keeping customers is just as important as acquiring them. These are the metrics you should be tracking.
This metric shows the percentage of customers who return over a given period. A high retention rate often leads to more sustainable revenue because retaining existing customers is typically cheaper than acquiring new ones. After all, loyal customers are more likely to make repeat purchases, refer others, and help increase the number of customers for your business.
By focusing on retention, you can build a loyal customer base that drives long-term success and boosts ROI.
The formula:

What’s a reasonable retention rate? It’s best to compare yourself against your industry peers. For instance, in the media and professional services sector, aiming for 84% is advisable, given the industry average. Conversely, the hospitality, travel, and restaurant industries typically see a lower retention rate of just 55%.

The churn rate refers to the percentage of customers who stop using your product or service over a given time period. A lower churn rate means happier, more satisfied customers will likely stay with your brand longer, leading to more consistent sales from your marketing department. You must reduce churn to maintain a stable revenue stream and keep your sales funnel flowing efficiently.
Calculate it like this:
.png)
When we talk about the repeat purchase rate, we’re referring to the percentage of customers who make more than one purchase. It’s a solid indicator of customer loyalty. When customers keep returning, it shows they're happy with their first experience and have built trust in your brand.
Calculating it is pretty straightforward:

Customer lifetime value, also known as ‘lifetime value’ (LTV), gives you a peek into how much revenue a single customer can bring in over their time with your business. Understanding your average customer lifetime value helps you plan for the long haul—like deciding how much to invest in getting and keeping customers happy, and aligning your goals with sustainable growth. It’s your go-to metric for keeping tabs on how well you’re building lasting relationships with your customers.
The formula goes like this:

You know those surveys that ask, "On a scale of 0 to 10, how likely are you to recommend this product/company to a friend or colleague?" Those are to measure the net promoter score. Your score tells how happy and loyal your customers are by seeing how likely they would recommend your product to others.
Promoters (those who score 9 or 10) are enthusiastic about recommending your brand, indicating high satisfaction and loyalty. Detractors (those who score 0 to 6) are less likely to recommend, highlighting areas needing improvement.
So, if your business gets a high NPS, your customers are ready to shout about your brand from the rooftops 👏
This is how you calculate the score:

Phew! Wrangling all the right metrics can be quite a task. That's precisely why Madgicx’s One-Click Report was born – to gather all your crucial metrics into one powerful live dashboard. No more juggling across different platforms while your business insights slip through the cracks.

Monitor your metrics and key performance indicators effortlessly across Google Ads, Meta, Google Analytics 4, TikTok, Klaviyo, and Shopify accounts. With ready-made report templates, even the busiest or most easily distracted can create professional reports with a single click.
Need to share reports with marketing teams, sales teams, or stakeholders? Just send them the shareable link. Test it out with the free 7-day trial.
With Madgicx's One-Click Report, view all your marketing metrics across Meta, Google Ads, GA4, TikTok, and Shopify in one real-time, user-friendly dashboard. Hit your key performance indicators, increase your ROI, and make smarter business decisions infinitely faster.
.avif)
Digital copywriter with a passion for sculpting words that resonate in a digital age.