Think Your Ad Strategy Still Works in 2023?
Get the most comprehensive guide to building the exact workflow we use to drive kickass ROAS for our customers.


Let’s start at the end. The end of Facebook Analytics was announced in July 2021 as an attempt to “consolidate business tools.” But every end is followed by a new beginning.
In this article, we’re taking a look at all the free tools Facebook is offering as an alternative, plus one tool that is proven to be very efficient for tracking those essential metrics and creating reports in one click.
All the way back to 2007, when Facebook launched Pages for business, a new necessity had arisen. As businesses understood the staggering potential of advertising on Facebook, the need to track performance has forced Facebook to create analytic tools.
While Facebook grew from a basic social network into a powerful marketing platform, the process of adding and expanding the analytical features gradually led to the birth of Facebook Analytics as a standalone tool for businesses and marketers in 2017.
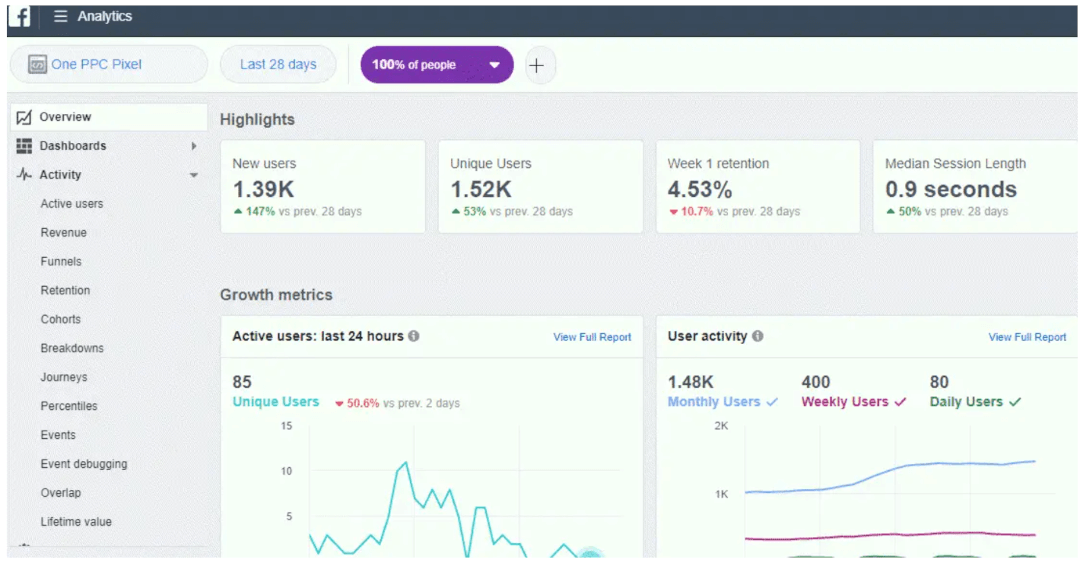
As you could have already guessed, Facebook Analytics had to give way to various analytical tools that allow better performance measuring and reporting. Let’s take a look at four of them so you can determine which ones fit your needs best.
We have gathered four instruments that are widely used to measure creative performance, track Facebook metrics, and build pristine reports. Since over 3 billion people use Facebook every month, it’s crucial to track your performance to optimize your ad costs.
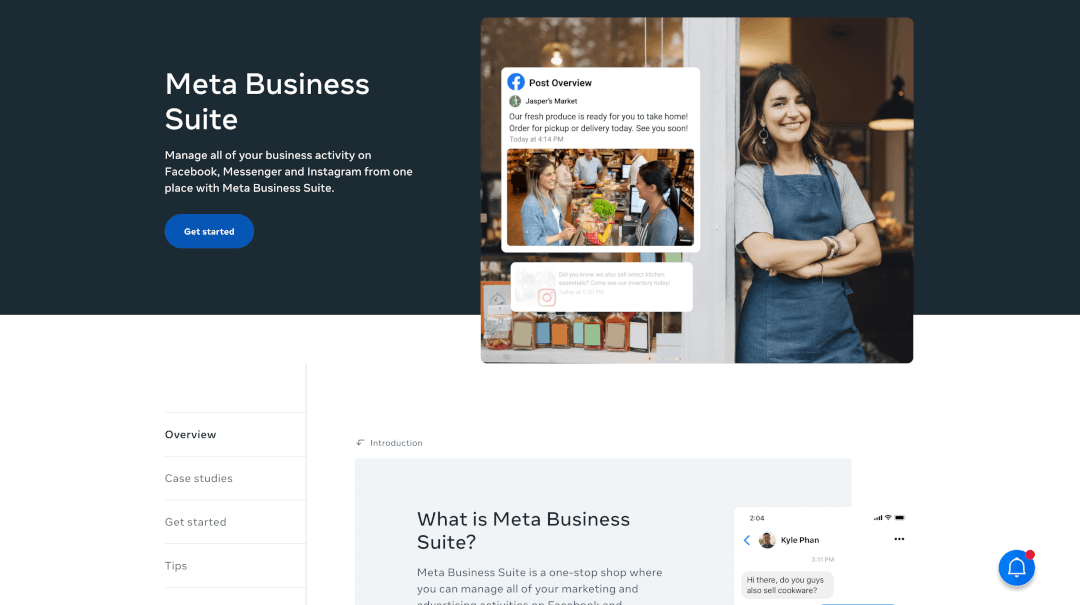
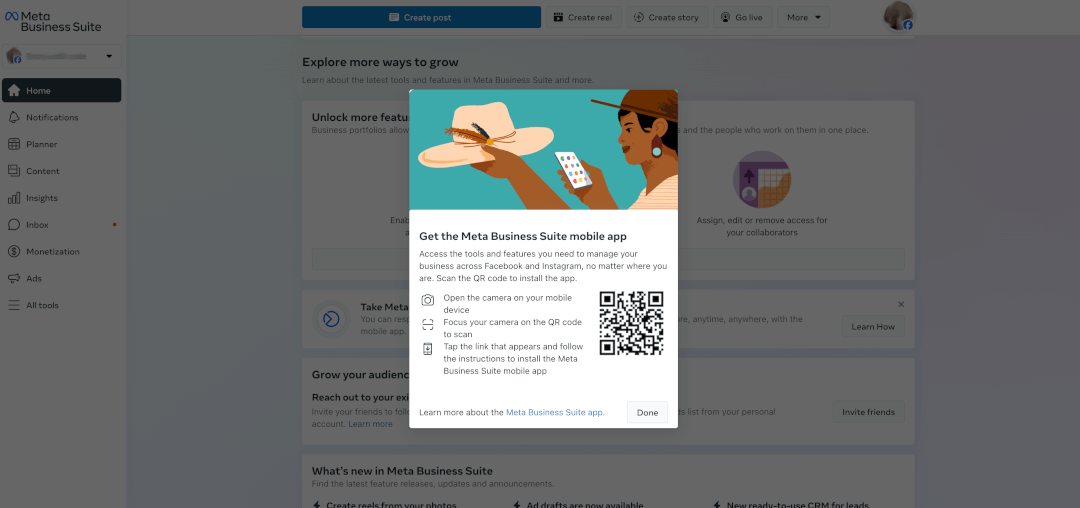
This is a one-stop shop for businesses: You can use Meta Business Suite to create content, schedule posts, engage with your customers, and, finally, analyze data. It is mostly useful for managing different aspects of content distribution.

While Meta Business Suite is obviously set to become a holistic solution for advertisers, a few Facebook analytics tools have not yet been completely absorbed by it. The expansion of Meta Business Suite is rapid. For example, Audience Insights is now called just Insights and has become a massive tab on the Meta Business Suite dashboard, together with some other instruments like Creator Studio.
To open your Meta Business Suite:
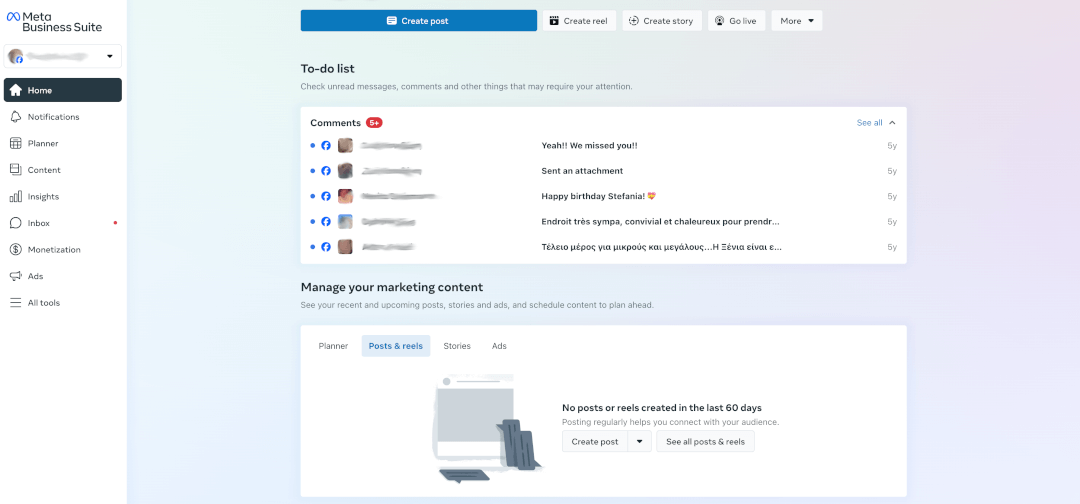
Pros: Meta Business suite is free. Once you create a Facebook Page or an Instagram business account, you can access Meta Business Suite via desktop or mobile app. It gives a broad spectrum of instruments, becoming a holistic solution for SMBs.
Cons: Due to data collection and processing methods, there are discrepancies between Meta Business Suite analytics and other tools. Some users are noticing occasional issues with the accessibility throughout different devices.
Another one of the free Facebook tools that allows you to track your business’s performance on the platform. Meta frequently updates this instrument making sure you have all the Facebook analytics data relevant to your business Page.
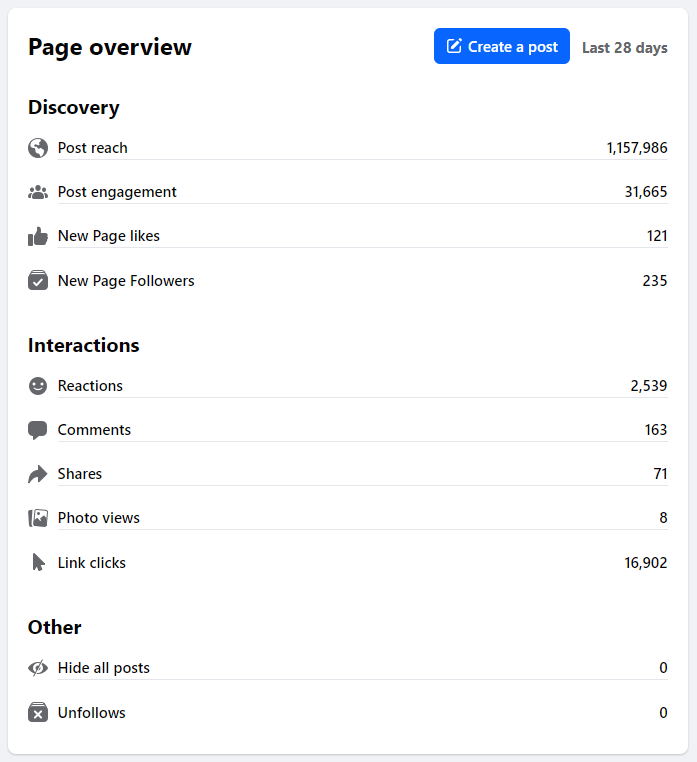
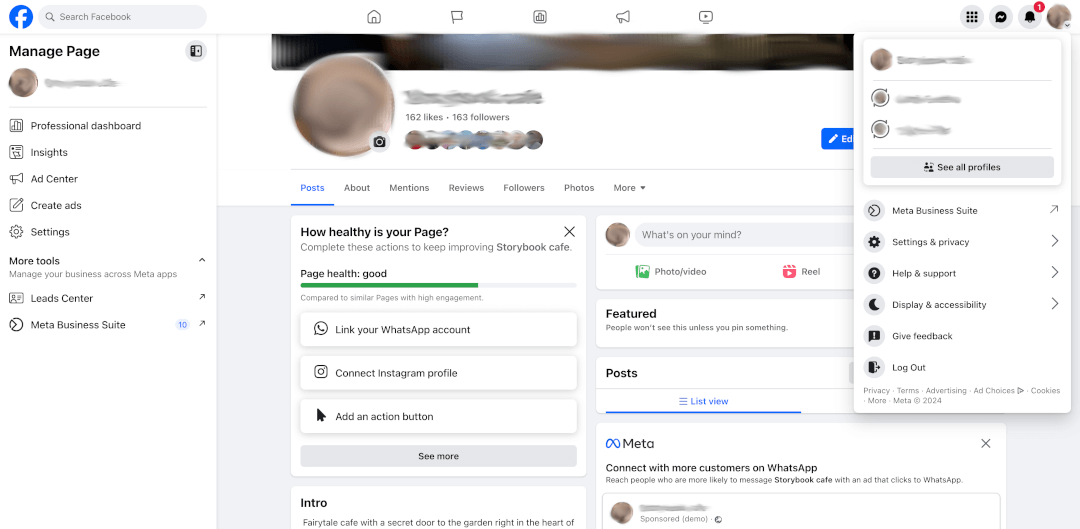
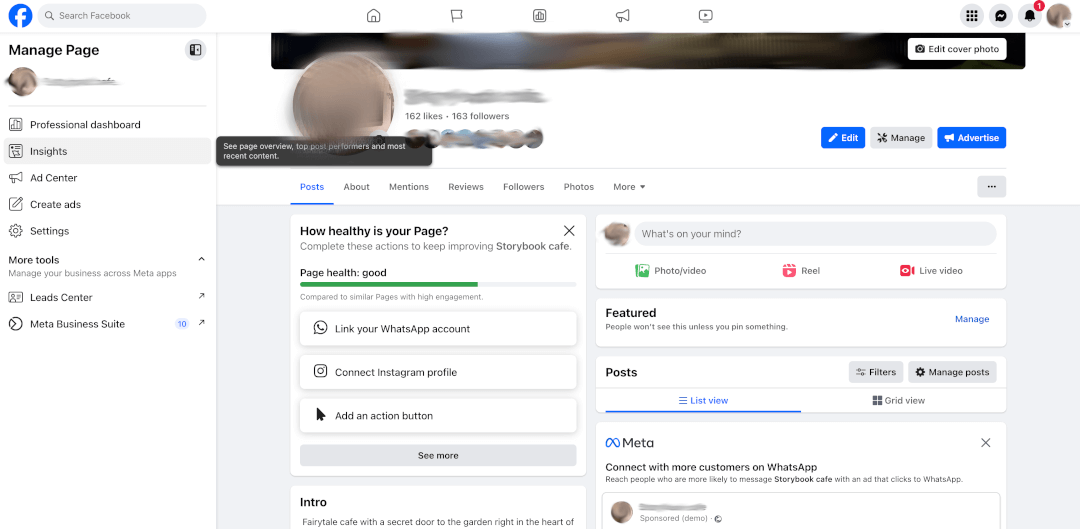
To see Page Insights:

Pros: Again, it’s a free tool that helps any business with a Facebook presence analyze its Page's performance. Facebook Page Insights are very useful for tracking engagement and getting insights on followers, likes, and videos. There’s an integration with Meta Business Suite that allows you to export your data.
Cons: There are standard time limitations on how far back the insights can go. As Meta is putting it: “Keep in mind that you can only access data in Page Insights for the last 2 years, and demographic data, such as age, gender, and location, are available in Page Insights once there is data for 100 or more people.” While few would expect analytics for less than 100 people, insights for a customized period would be useful since Pages have been available for 15+ years already.
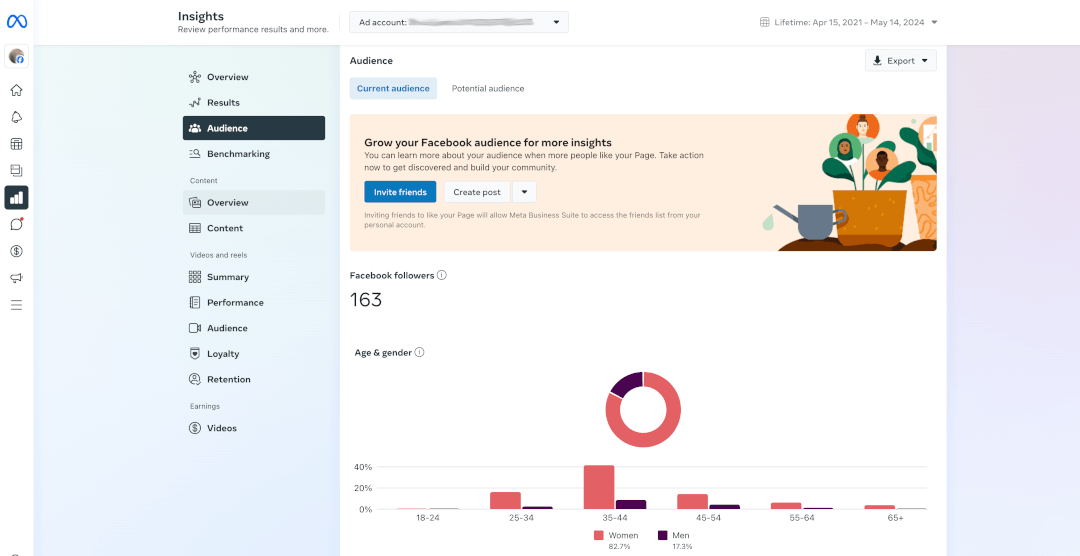
Former Facebook Audience Insights are now incorporated into Meta Business Suite and remain a valuable source of information on your audience demographics: age, gender, top cities and countries, location, and interests.
But the most exciting part of Audience Insights is a tab called Potential Audience. With this insight, you can get a better picture (painted in numbers) of your demographics by applying filters.

To see Facebook Audience Insights:
Pros: Learn more about your audience demographics and geography.
Cons: There are only a few data parameters. To discover a simple way to create lookalike audiences, try our next tool.
Madgicx presents you with a holistic solution for all of your advertising needs. It’s integrated with all of Meta’s platforms and helps you throughout all of your advertising – from designing a creative to making a One-Click Report.
Specifically for getting insights on Facebook analytics, you can use Madgicx’s 360° Meta Audit. The 360° Meta Audit is a powerful tool that provides in-depth analytics and insights for your ad account, taking your performance beyond standard reach.
It allows you to analyze budget distribution, creative performance, and audience segmentation in great detail, leading to actionable insights and optimized advertising strategies.

To use Madgicx:


Pros: Madgicx is basically the only tool you need to streamline your performance on Facebook. From getting inspired by creatives and templates to receiving cross-channel analytics and valuable insights generated by AI – whenever you have any questions or need assistance, Madgicx offers chat support.
Cons: Only the trial period is free.
Discover an easier way to manage your Facebook analytics with Madgicx - Try for Free
Choosing and tracking relevant metrics is strategically important for every business. Traditionally, the key metrics you should be tracking depend on your customer’s awareness stage - also referred to as the position in the sales funnel.
The funnel might be slightly different for various areas and business sizes and also depends on your priorities. But in any case, you have to have a clear understanding of which Facebook metrics matter and why.
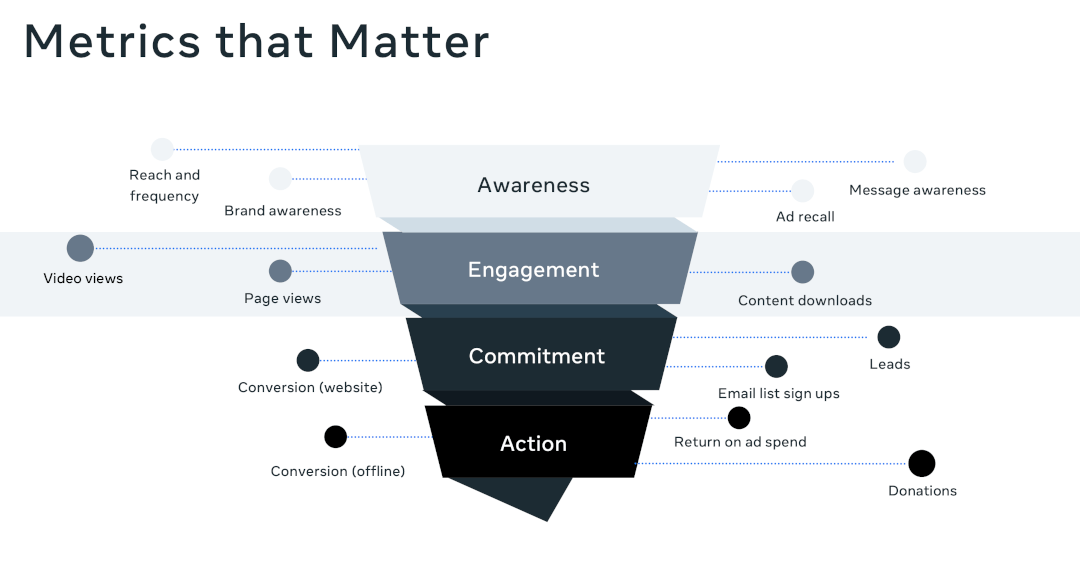
Apart from the “health level” you can find on your Facebook Page dashboard, there are several metrics to keep in mind:
The most fascinating feature of Insights is the chance to see your potential audience. By applying filters, you can see the approximate size of your target demographics. This way, you can refine your targeting based on language, age, gender, and location.

You can really narrow it down by listing the interests of your audience. Insights also give you an approximate number of Facebook users you can target based on those filters.

If you are utilizing a lot of video content, you should be tracking the following metrics:
Facebook ads are one of the most powerful forces in marketing: the audiences are massive, the competition is high, and the metrics are plenty. So, while you’re navigating Facebook Ads Manager, consider investing in a powerful tool, so you could really harvest the potential of Facebook ads. Enhance your ad performance with Madgicx and get those insights you won't find anywhere else.
Engagement Metrics:
Delivery Metrics:
Performance Metrics:

Facebook Pixel analytics lets you track the audience coming to your site from Facebook. It lets you gather data and target your existing audience. And it does all this while respecting their privacy.
With this tool, your Facebook ads will be shown to people who have already visited your page, thus softly pushing them down the sales funnel and improving your CTR. Meta recommends using the Pixel alongside Conversions API.
To export your Page's insights data:
1. Click Insights at the top of your Page.
2. Click Export Data in the top right.
3. Select a data type, file format, and date range. You may also need to choose a layout.
4. Click Export Data again.
The end of Facebook Analytics did not leave an unfillable void: there are several tools that provide insight. Some of them are provided by Meta, some are available for a fee. To track all of the important metrics, try 360° Meta Audit by Madgicx and harvest the full potential of your Facebook presence.
Our 360° Meta Audit tool provides you with detailed insights and analytics, enabling you to make data-driven decisions that deliver results. Don't miss out on the opportunity to optimize your ad campaigns and achieve unparalleled success.
.avif)
Xenia is an old-school marketer who adores disruptive messages and Rory Sutherland. Intrigued by the ideas of evolution and inevitable singularity, Xenia likes to sprinkle some history on top of her posts. When she’s not writing, she reads whatever she can find, including paperback novels, coupons and candy wrappers.