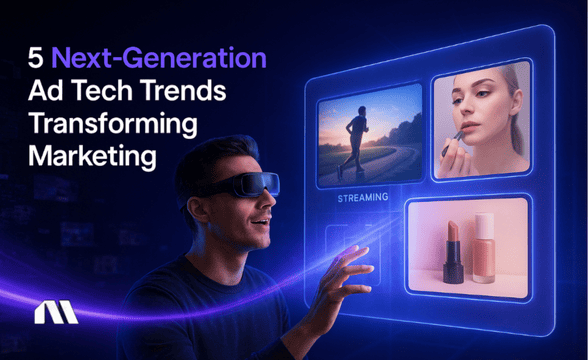
Think Your Ad Strategy Still Works in 2023?
Get the most comprehensive guide to building the exact workflow we use to drive kickass ROAS for our customers.


Picture this: Your Facebook ads that crushed it in 2022 are now barely breaking even. Meanwhile, your experimental TikTok campaigns are delivering 3x ROAS with audiences you've never targeted before. Sound familiar?
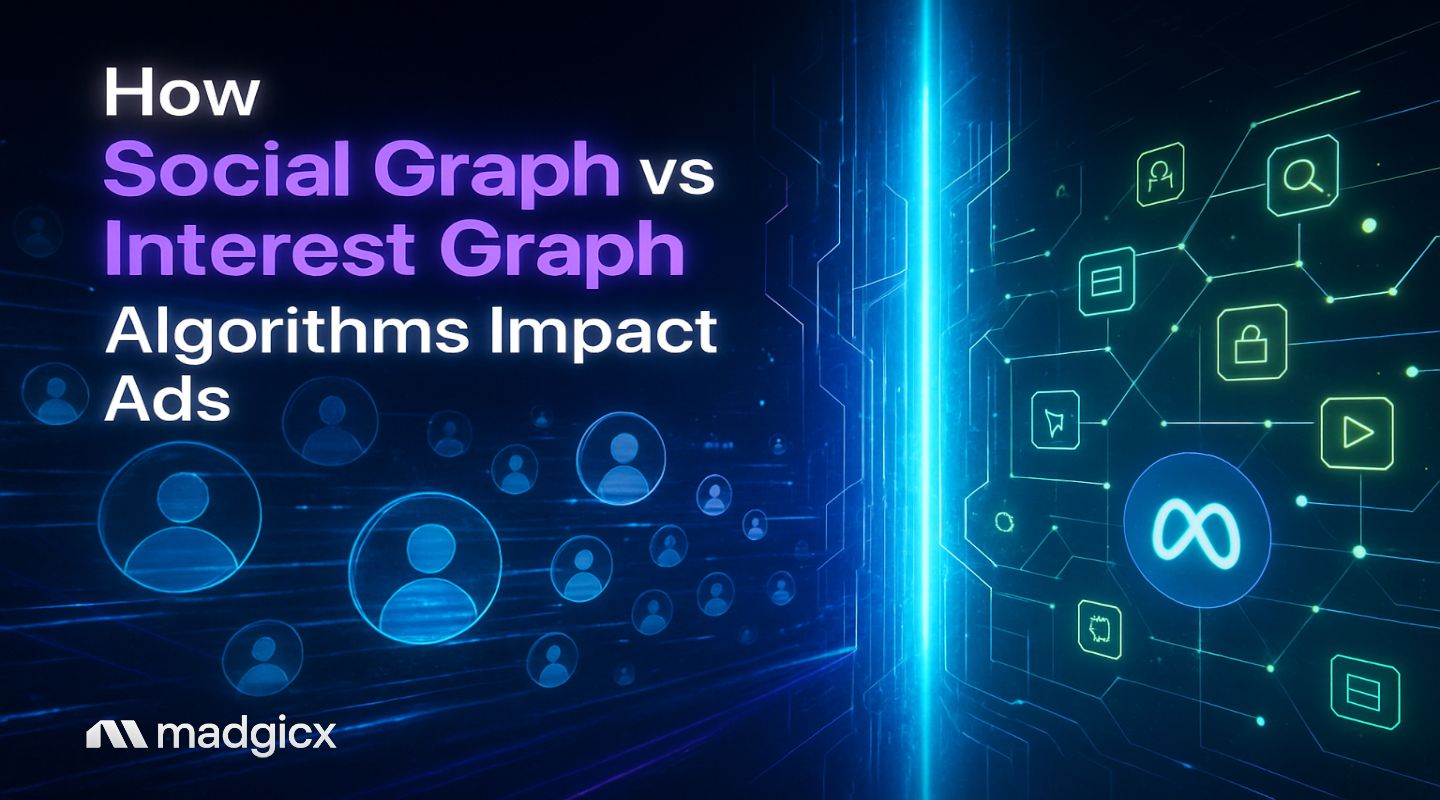
You're not alone—and it's not your fault. The fundamental difference between social graphs (connections-based) and interest graphs (behavior-based) is reshaping how algorithms serve content and ads. This directly impacts your campaign performance and attribution models.
While Facebook built its empire on who you know, TikTok conquered the world by understanding what you actually want to see. Here's the thing: understanding these algorithmic foundations isn't just marketing theory anymore. It's crucial for optimizing ad spend allocation and creative strategies across platforms.
Let's dive into how these invisible forces are affecting your bottom line and what you can do about it.
The algorithm shift isn't just changing organic reach. It's fundamentally altering how your paid campaigns perform. If you've noticed your Facebook CPMs creeping up while your TikTok experiments outperform established campaigns, you're witnessing the graph revolution firsthand.
Social graphs prioritize content based on relationships and connections. Facebook pioneered this model, serving content from friends, family, and pages you follow.
For us advertisers, this means:
Interest graphs serve content based on user behavior, preferences, and engagement patterns—regardless of connections. TikTok mastered this approach, and it's why you can go viral without any followers.
For us performance marketers, this translates to:
According to Giraffe Social Media's 2025 research, TikTok has 150% higher engagement rates than Instagram. This is a direct result of interest graph optimization prioritizing engaging content over connection-based distribution.
Pro Tip: Use Madgicx's audience insights to identify which graph type drives better performance for your specific products. The platform's AI helps adjust bidding strategies based on whether you're targeting through social connections or interest behaviors.
Not all platforms are created equal when it comes to converting your ad spend. Each platform's algorithmic foundation directly impacts how your campaigns perform, scale, and attribute conversions.
Facebook's algorithm has evolved from pure social graph to a hybrid model. According to Zozimus research, up to 50% of Facebook user feeds now contain posts from creators they don't follow. This represents a massive shift toward interest-based content discovery.
Performance Implications:
TikTok's algorithm operates on pure interest signals, making it the ultimate discovery platform. The Influencer Marketing Factory reports engagement rates ranging from 2.88% to 7.50% depending on follower count—significantly higher than traditional social platforms.
Performance Advantages:
LinkedIn maintains a professional social graph model, making it unique for B2B performance marketing.
B2B Performance Characteristics:
Quick Tip: Allocate 60% of discovery budget to interest-driven platforms like TikTok, 40% to social graph platforms like Facebook for retargeting campaigns. This ratio maximizes both reach and conversion efficiency.
The iOS 14.5 update hit social graphs harder than interest graphs. Here's why, and what it means for your attribution modeling.
Social graph platforms rely heavily on connection data and cross-app tracking, making them more vulnerable to privacy restrictions:
Interest-based platforms use behavioral signals that are more privacy-compliant:
For deeper insights into attribution modeling, check out our guide on advertising performance knowledge graphs and how they're revolutionizing campaign measurement.
Your creative strategy should match the algorithm's content discovery method. What works on Facebook's social graph won't necessarily perform on TikTok's interest graph—and vice versa.
Social graph algorithms prioritize content that generates social interactions and leverages existing connections.
Winning Creative Elements:
Creative Testing Approach:
Interest graph algorithms prioritize engaging content that captures attention and drives immediate interaction.
High-Performance Creative Elements:
Creative Testing Framework:
For interest graph platforms, our democratizing advertising intelligence article explores how AI tools can help identify winning creative patterns across different algorithm types.
Smart marketers don't put all their budget in one algorithmic basket. Here's how to optimize spend allocation across different graph types for maximum ROI.
70% Interest Graph Platforms (Discovery Focus):
30% Social Graph Platforms (Conversion Focus):
Weekly Review Metrics:
Monthly Reallocation Strategy:
Based on Sprout Social's 2025 data showing Instagram's engagement rate dropped 28% year-over-year to 0.50%, while Emplicit research shows TikTok maintains an average engagement rate of 2.5%, consider shifting discovery budgets toward interest graph platforms.
Q4 Holiday Strategy:
Q1 Discovery Strategy:
Pro Tip: Madgicx's AI helps optimize budget allocation based on real-time performance across different algorithm types, supporting optimal spend distribution without manual monitoring.
Interest graphs unlock audience expansion opportunities social graphs can't match. Here's how to leverage each algorithm type for maximum reach and efficiency.
Social Graph Lookalikes:
Interest Graph Lookalikes:
Platform-Specific Interest Targeting:
Cross-Platform Interest Mapping:
Sequential Targeting Approach:
Unified Customer Journey Optimization:
For advanced audience expansion techniques, explore our comprehensive guide on ad intelligence tools that help identify winning audience strategies across different platform algorithms.
The algorithm evolution isn't slowing down. Here's how to stay ahead of the curve and maintain competitive advantage as graph types continue evolving.
Content Graphs: Platforms are developing content-based recommendation systems that prioritize content quality over both connections and interests. YouTube's algorithm increasingly focuses on content satisfaction metrics rather than subscriber relationships.
Social Commerce Graphs: Instagram and TikTok are building purchase behavior graphs that combine social signals with shopping intent, creating hybrid attribution models.
Privacy-First Graphs: New algorithmic approaches that deliver personalization without individual tracking, using cohort-based targeting and federated learning.
First-Party Data Integration:
Server-Side Tracking Implementation:
Contextual Targeting Preparation:
Algorithm-Agnostic Strategy Development:
Emerging Platform Preparation:
Investment in AI-Powered Optimization:
Tools like Madgicx's AI optimization help adapt to algorithm changes across platforms, supporting consistent performance regardless of how social or interest graphs evolve. The platform's machine learning models continuously adjust to new algorithm signals, helping maintain Meta campaign performance during major platform updates.
Try Madgicx’s AI for free right here.
Interest graphs typically deliver 20-30% better discovery ROAS due to lower CPMs and higher engagement rates, while social graphs excel at retargeting with 40% higher conversion rates. The optimal strategy combines both: use interest graphs for customer acquisition and social graphs for conversion optimization.
Use unified attribution models that account for each platform's unique user journey patterns. Social graph platforms work better with 7-day attribution windows, while interest graphs perform optimally with 1-3 day attribution. Implement server-side tracking solutions like Madgicx's Cloud Tracking for accurate cross-platform measurement.
Absolutely. Social graph platforms respond better to social proof, user-generated content, and community-focused messaging. Interest graphs favor hook-driven content, immediate value propositions, and trend integration. Test creative variations specifically designed for each algorithm type's content discovery method.
Review performance weekly and reallocate monthly based on 30-day attribution windows. Account for each platform's typical conversion timeline—interest graphs often show faster results, while social graphs may have longer attribution periods. Use performance thresholds like 25% CPA variance to trigger reallocation decisions.
Applying one-size-fits-all strategies across platforms instead of optimizing for each algorithm's unique content discovery and user behavior patterns. Many marketers use the same targeting, creative, and attribution approaches across social and interest graphs, missing significant performance opportunities.
The algorithmic landscape has fundamentally shifted, and your advertising strategy needs to evolve with it. Interest graphs offer superior discovery potential with 150% higher engagement rates, while social graphs excel at retargeting with stronger conversion intent.
Attribution modeling must account for each graph type's unique user journey, and budget allocation should favor interest-driven platforms for discovery while leveraging social graphs for conversion. The key insight? Stop treating all platforms the same.
Each algorithm type requires specific optimization approaches, creative strategies, and measurement frameworks. Start by auditing your current platform performance and reallocating budget based on each algorithm's strengths—a 60/40 split favoring interest-driven discovery campaigns is often the optimal starting point.
Madgicx's AI optimization helps adjust your campaigns based on each platform's algorithm signals, supporting better performance whether you're targeting through social connections or interest behaviors. The platform's machine learning continuously adapts to algorithm changes, helping maintain campaign performance while maximizing opportunities across all graph types.
Start optimizing across all algorithm types with Madgicx's free trial
Reduce guesswork about which platforms may deliver better ROI. Madgicx's AI-powered Meta ad optimization helps adjust your campaigns based on each platform's unique algorithm signals, whether social graph or interest graph driven.
.avif)
Digital copywriter with a passion for sculpting words that resonate in a digital age.