

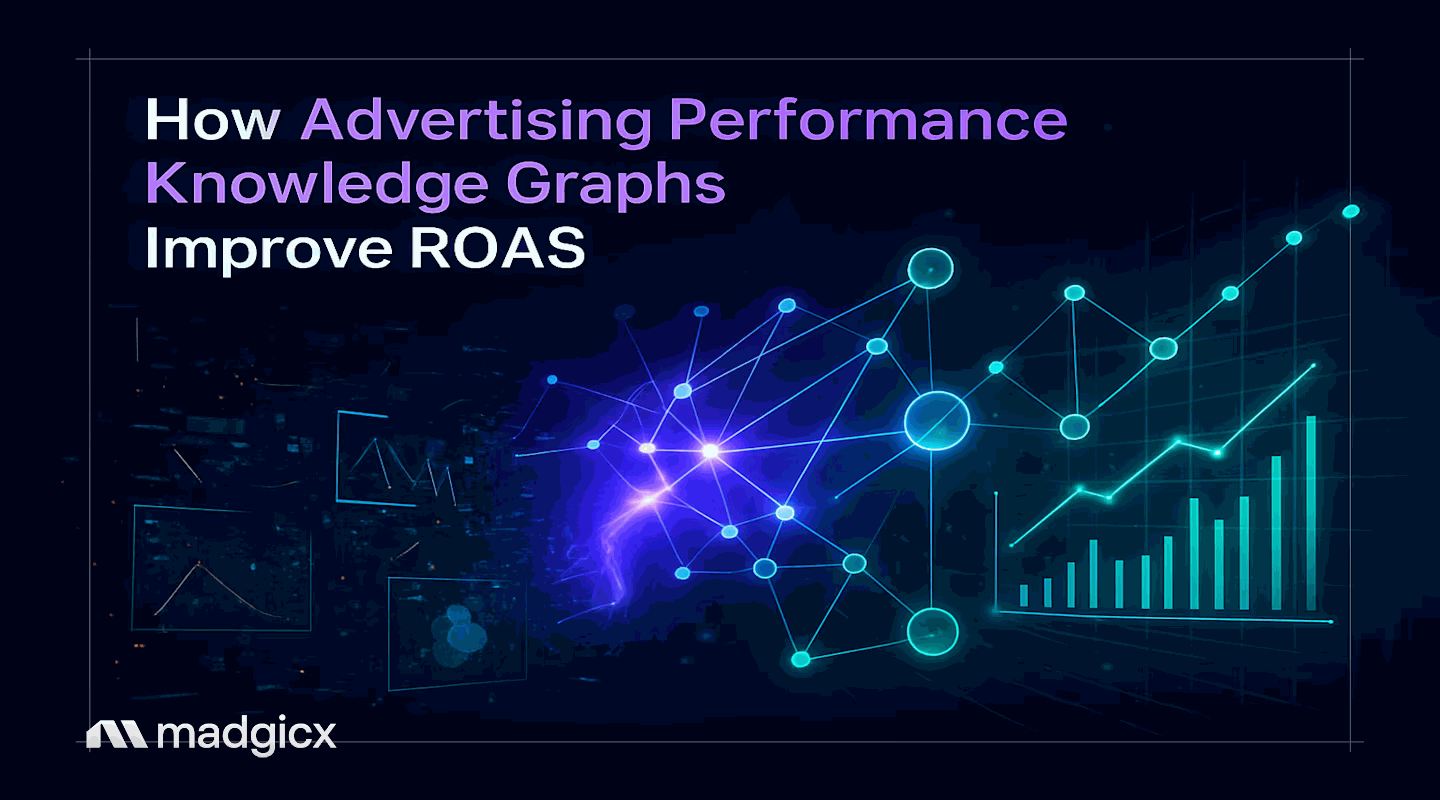
Think Your Ad Strategy Still Works in 2023?
Get the most comprehensive guide to building the exact workflow we use to drive kickass ROAS for our customers.


Picture this: It's 8 AM, and you're already drowning. Five browser tabs open—Meta Ads Manager showing one conversion number, Google Ads claiming different attribution, TikTok Ads with its own version of "truth," your analytics platform telling yet another story, and your attribution tool basically shrugging its digital shoulders.
Sound familiar?
You're not alone in this data nightmare. Every performance marketer I know spends at least 3 hours each morning playing detective, trying to piece together what's actually driving results across their campaigns. It's like trying to solve a puzzle where half the pieces are missing and the other half keep changing shape.
Here's the thing though—there's a solution that's been quietly revolutionizing how smart advertisers approach this chaos. An advertising performance knowledge graph is a connected data structure that unifies campaign metrics, customer touchpoints, and attribution data across all advertising platforms into a single, intelligent system that reveals true cross-channel performance patterns.
This isn't just another analytics buzzword. We're talking about a proven framework designed to help performance marketers improve click-through rates and lead generation by finally connecting the dots between fragmented campaign data.
By the end of this guide, you'll have everything you need to build your own advertising performance knowledge graph system. We'll cover how to connect fragmented advertising data across Meta, Google, and TikTok into unified performance insights.
You'll walk through a step-by-step implementation roadmap designed to improve ROAS, and see real-world case studies showing significant lead generation improvements.
Plus, I'll give you a bonus attribution modeling framework that addresses multi-touchpoint customer journey tracking challenges—no more guessing which touchpoint actually drove that conversion.
Let me guess—you've got that one campaign that's "performing well" in Facebook Ads Manager, but when you check your actual revenue dashboard, the numbers don't add up. Meanwhile, Google Analytics is telling you a completely different story about which traffic sources are converting, and your email platform swears it's responsible for most of your sales.
This isn't just frustrating; it's expensive. Really expensive.
The knowledge graph market is exploding toward $6.93 billion by 2030 with a 36.6% compound annual growth rate, and there's a reason why. Businesses are finally waking up to the massive cost of fragmented data.
When your advertising data lives in silos, you're essentially flying blind. You can't optimize what you can't measure accurately, and you definitely can't scale what you don't understand. The result? Wasted ad spend, missed opportunities, and that nagging feeling that you're leaving money on the table.
The advertising landscape has become incredibly complex, but our measurement tools are still stuck in the single-platform era. It's time to evolve.
Alright, let's cut through the technical jargon and get to what actually matters for your campaigns.
An advertising performance knowledge graph is essentially a smart database that understands the relationships between all your advertising elements—campaigns, audiences, creatives, conversions, and customer touchpoints—across every platform you're running ads on. Think of it as creating a "brain" for your advertising data that can see patterns and connections that would be impossible to spot manually.
But here's where it gets interesting for us performance marketers: unlike general business knowledge graphs that try to connect everything under the sun, advertising performance knowledge graphs are laser-focused on the specific entities and relationships that drive campaign performance.
Entities are your advertising building blocks: specific campaigns, ad sets, individual creatives, audience segments, landing pages, and conversion events. Each entity has properties like spend, impressions, clicks, and conversions.
Relationships map how these entities connect: which creative performed best with which audience, how upper-funnel awareness campaigns influence lower-funnel conversion campaigns, and which customer journey paths lead to the highest lifetime value.
Properties are the performance metrics that matter: not just basic metrics like CTR and CPC, but advanced insights like cross-platform attribution weights, audience overlap coefficients, and creative fatigue indicators.
The magic happens when you connect these elements across platforms. Instead of seeing "Campaign A spent $500 and got 20 conversions" in isolation, you see "Campaign A on Meta drove awareness that led to Google search campaigns converting at higher rates, while the creative elements from Campaign A performed better when adapted for TikTok."
This isn't just better reporting—it's a fundamentally different way of understanding advertising performance that reveals optimization opportunities invisible in traditional platform-specific dashboards.
Now we're getting to the good stuff—the actual performance improvements you can expect when you stop treating your advertising platforms like isolated islands.
Studies show that advertisers using connected knowledge graph approaches are seeing improved click-through rates and enhanced lead generation compared to traditional fragmented approaches. But let me break down exactly why this happens and what it means for your bottom line.
Here's something that'll blow your mind: when your advertising data is properly connected, you can optimize campaigns based on performance signals from other platforms.
For example, if your Meta awareness campaigns are driving high-quality traffic that converts better on Google Ads, your advertising performance knowledge graph can help you increase Meta budgets while adjusting Google bid strategies to capture that higher-intent traffic. This kind of cross-platform optimization is impossible with siloed data.
Traditional last-click attribution is basically useless in today's multi-touchpoint customer journeys. Advertising performance knowledge graphs address this by tracking the actual influence each touchpoint has on conversions, not just which one happened to be last.
Studies show that connected attribution systems are 70% more accurate than traditional models. What does this mean practically? You stop under-investing in upper-funnel campaigns that drive awareness and over-investing in bottom-funnel campaigns that just capture demand you've already created.
Remember those 3 hours you spend every morning trying to make sense of your data? Advertising performance knowledge graphs typically reduce daily reporting and analysis time significantly. That's not just a nice-to-have—it's a competitive advantage.
When you're not spending half your day on data reconciliation, you can focus on what actually moves the needle: creative testing, audience expansion, and strategic optimization. Your team becomes more effective, your campaigns perform better, and you can scale without burning out.
This is where things get really exciting. Connected advertising data doesn't just tell you what happened—it helps predict what's about to happen. Your advertising performance knowledge graph can identify creative fatigue before performance drops, spot audience saturation before CPMs spike, and predict which new audience segments are most likely to convert based on historical patterns.
The result? You're always one step ahead of performance issues instead of constantly reacting to them.
Pro Tip: The most successful advertising performance knowledge graph implementations start with just two platforms (usually Meta and Google) to prove value quickly, then expand to additional channels once the team sees clear ROI.
Okay, enough theory. Let's get into the nuts and bolts of actually building this thing. I've broken this down into six manageable steps that you can implement over 2-4 weeks (or much faster if you're using a platform like Madgicx that has pre-built connectors).
Start by mapping every advertising platform and data source you're currently using. This typically includes Meta Ads Manager, Google Ads, TikTok Ads, your website analytics, email marketing platform, and any attribution tools.
For each platform, you'll need to establish API connections that can pull performance data regularly. Don't worry if this sounds technical—most modern advertising platforms have robust APIs, and tools like ad intelligence tools can handle the heavy lifting for you.
Pro Tip: Start with your highest-volume platforms first. You'll see immediate benefits from connecting just Meta and Google before expanding to other channels.
This is where you define what matters for your specific business. Create a standardized taxonomy for naming campaigns, audiences, and creatives across platforms.
For example, if you're running similar audiences on Meta and Google, make sure they're tagged consistently so your advertising performance knowledge graph can identify cross-platform performance patterns. The same goes for campaign objectives and creative themes.
Map out how your advertising touchpoints actually influence each other. This might include:
Connect the metrics that actually matter for your business goals. This goes beyond basic platform metrics to include:
Establish data flows that update your advertising performance knowledge graph regularly. This ensures you're making optimization decisions based on current performance, not yesterday's data.
The key here is setting up alerts and triggers that notify you when performance patterns change significantly across platforms.
Create rules that take action based on your advertising performance knowledge graph insights. This might include:
Let's get specific about how to connect your major advertising platforms into a unified advertising performance knowledge graph system.
Meta's Marketing API is robust and provides access to campaign performance, audience insights, and creative metrics. The key is setting up proper attribution windows and ensuring you're capturing both on-platform and off-platform conversion data.
Focus on connecting Meta's audience insights with your other platforms' performance data. When you can see how Meta audiences perform across Google Ads and email marketing, you unlock powerful optimization opportunities.
Google Ads API integration should focus on search query data, audience performance, and conversion paths. The real value comes from connecting Google's search intent data with your other platforms' awareness and consideration metrics.
Pay special attention to how your Meta and TikTok awareness campaigns influence Google search volume and conversion rates. This relationship is often the biggest source of attribution errors in traditional measurement.
TikTok's attribution can be tricky because the platform skews younger and mobile-first, with different user behavior patterns than Meta or Google. Focus on connecting TikTok's engagement metrics with downstream conversion events on other platforms.
The key insight here is that TikTok often drives awareness that converts through other channels, so traditional last-click attribution significantly undervalues TikTok's contribution to your overall performance.
This is where advertising performance knowledge graphs really shine. By connecting audience performance across platforms, you can identify which audience segments are most valuable and ensure you're reaching them efficiently across all channels.
Use hashed email matching, lookalike audience performance data, and behavioral pattern analysis to create unified audience profiles that work across platforms.
Pro Tip: Madgicx's pre-built connectors significantly reduce the technical setup work for major advertising platforms (including Meta). Instead of spending weeks on API integration, you can focus on optimization strategy from day one. A free trial is available.
Let me share three real examples of how advertising performance knowledge graphs have transformed performance for different types of businesses.
A mid-size fashion e-commerce brand was struggling with attribution across Meta, Google, and email marketing. They were over-investing in Google Shopping campaigns (which appeared to drive most conversions) while under-investing in Meta awareness campaigns.
After implementing an advertising performance knowledge graph approach, they discovered that Meta awareness campaigns were actually driving a significant portion of their Google search volume. By properly attributing this influence, they:
The key insight was that their customer journey typically started with Meta discovery, continued with Google research, and converted through email remarketing. Traditional attribution was only crediting the final touchpoint.
A performance marketing agency was hitting a scaling wall because each new client required hours of daily data reconciliation across platforms. Their team was spending more time on reporting than optimization.
By implementing standardized advertising performance knowledge graph frameworks across all client accounts, they:
The agency now uses advertising performance knowledge graph insights as a key differentiator in new business pitches, showing prospects exactly how fragmented data is limiting their current performance.
A direct-to-consumer startup was struggling with creative performance across Meta, TikTok, and Google Display campaigns. Each platform seemed to respond to completely different creative approaches, making it impossible to develop a cohesive creative strategy.
Their advertising performance knowledge graph revealed that:
By connecting creative performance data across platforms, they achieved improved average CTR and developed a scalable creative testing framework that works across all channels.
Now that you understand how to build and implement advertising performance knowledge graphs, let's talk about measuring their impact on your business.
Cross-Platform ROAS: Instead of measuring ROAS for each platform separately, track blended ROAS that accounts for cross-platform influence. This gives you a true picture of advertising efficiency.
Attribution Accuracy Score: Measure how well your advertising performance knowledge graph predicts actual business outcomes compared to traditional last-click attribution. Most businesses see significant improvement in attribution accuracy.
Optimization Speed: Track how quickly you can identify and act on performance changes. Advertising performance knowledge graphs typically reduce optimization response time from days to hours.
Data Reconciliation Time: Measure the time saved on manual reporting and analysis. This is often the most immediate and noticeable benefit.
Here's a simple framework for calculating the ROI of your advertising performance knowledge graph implementation:
Cost Savings: Calculate time saved on manual data work (typically 2-3 hours daily) multiplied by team hourly rates. For most teams, this alone justifies the investment.
Performance Improvements: Track the incremental ROAS improvement from better attribution and cross-platform optimization. Even modest ROAS improvements on significant ad spend deliver substantial additional monthly profit.
Scaling Efficiency: Measure how much additional ad spend you can manage effectively with the same team size. Advertising performance knowledge graphs typically allow significant scaling without proportional team growth.
Based on data from hundreds of implementations:
Your advertising performance knowledge graph dashboard should focus on actionable insights, not just pretty charts. Include:
Pro Tip: Focus on unified customer lifetime value metrics rather than platform-specific vanity metrics. The goal is business growth, not platform optimization in isolation.
With the right tools, basic implementation takes 2-4 weeks for most businesses. If you're building everything from scratch with custom development, expect 2-3 months. However, platforms like Madgicx offer pre-built advertising connectors that can reduce implementation time to 1-2 days for major platforms like Meta, Google, and TikTok.
The key is starting simple—connect your two highest-volume platforms first, then expand gradually.
Studies consistently show improved CTR and enhanced lead generation. Most marketers see positive ROI within 60 days of implementation, primarily from time savings and better attribution accuracy.
For context, if you're spending $50K monthly on ads, even modest ROAS improvements can deliver significant additional monthly profit—which typically covers implementation costs within the first month.
While custom builds require significant technical skills (API integration, database management, data pipeline setup), modern advertising platforms provide no-code solutions specifically designed for performance marketers.
The technical complexity depends on your approach: custom development requires a team of engineers, while platforms like Madgicx handle the technical infrastructure so you can focus on optimization strategy.
This is actually where advertising performance knowledge graphs excel. By connecting first-party data across platforms and using probabilistic attribution modeling, they're much more resilient to privacy updates than traditional pixel-based tracking.
Advertising performance knowledge graphs can identify customer journey patterns even when individual touchpoints are anonymized, making them future-proof against ongoing privacy changes.
Absolutely. The efficiency gains often justify implementation even for smaller budgets. If you're spending $10K+ monthly across multiple platforms, the time savings alone typically provide positive ROI.
The key is starting with your highest-volume platforms and expanding gradually as your budget grows. Even connecting just Meta and Google Ads can deliver significant insights for smaller advertisers.
We've covered a lot of ground here, but let's recap the key takeaways that'll transform your advertising performance:
Unified advertising data consistently delivers performance improvements by revealing cross-platform optimization opportunities that are invisible in traditional siloed reporting. The six-step implementation framework we've outlined provides a proven roadmap that hundreds of performance marketers have used successfully.
Platform-specific integration addresses the attribution challenges that plague modern multi-channel advertising, while the ROI typically turns positive within 60 days through a combination of time savings and performance improvements.
The advertising landscape will only get more complex, with new platforms, privacy changes, and attribution challenges emerging constantly. Advertising performance knowledge graphs aren't just a nice-to-have optimization—they're becoming essential infrastructure for any serious performance advertising operation.
With 69.1% of marketers already integrating AI into their operations, the question isn't whether AI-powered advertising intelligence will become standard—it's whether you'll be ahead of the curve or playing catch-up. For insights into the broader evolution of advertising technology, explore our analysis of next generation ad tech and its impact on performance marketing.
Start by auditing your current data sources and identifying your biggest attribution gaps. Which platforms are you running ads on? How much time do you spend daily trying to reconcile performance data? Where do you suspect you're missing important cross-platform insights?
Once you've identified your pain points, consider platforms like Madgicx that offer pre-built advertising performance knowledge graph capabilities. Instead of spending months on technical implementation, you can start seeing performance improvements within days.
The performance marketers who implement advertising performance knowledge graphs now will have a competitive advantage over those still stuck in the fragmented data era. The question isn't whether you'll eventually need unified advertising intelligence—it's whether you'll be an early adopter or play catch-up later.
Stop wasting hours reconciling data across platforms. Madgicx's AI-powered advertising platform helps connect your advertising performance data across Meta, Google, TikTok, and more, giving you the unified view you need to optimize ROAS effectively.
.avif)
Digital copywriter with a passion for sculpting words that resonate in a digital age.


.jpg)