Think Your Ad Strategy Still Works in 2023?
Get the most comprehensive guide to building the exact workflow we use to drive kickass ROAS for our customers.


You're in a QBR with your biggest client. The numbers are up, the graphs are green, and you're feeling pretty good. Then comes the question that makes every agency owner's stomach drop: "This is great... but is it good? How do we stack up against the competition?"
Sound familiar? Suddenly, your beautiful report feels like it's missing the most important page—the context.
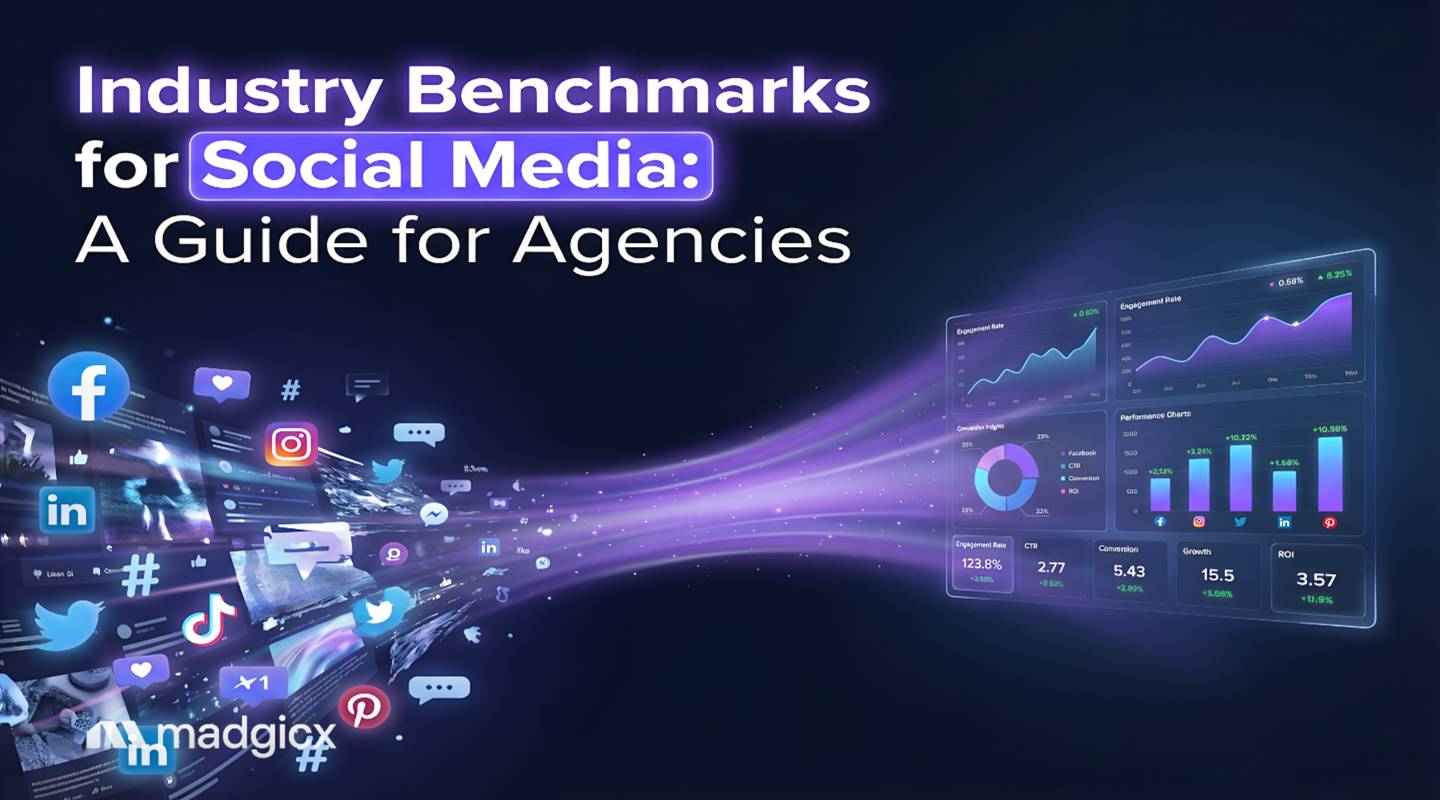
We get it. Finding reliable industry benchmarks for social media is a real challenge. You're either digging through a dozen different reports, trying to stitch together data from 18 months ago, or worse, finding stats that only cover organic posts when your client's budget is 90% paid ads. It's a frustrating spot to be in, trying to prove your value when you can't even define what "good" looks like.
So, let's cut through the noise. According to Hootsuite's 2025 report, a good average cross-platform engagement rate is between 1.4-2.8%, but that number is almost useless without context. It changes dramatically by industry, platform, and whether you're looking at paid or organic efforts.
This guide is the comprehensive resource we all wish we had. It's built specifically for agencies to answer those tough client questions, turn data into a strategic advantage, and finally demonstrate your clear ROI.
Alright, let's start with the basics. Social media benchmarks are performance standards used to measure the effectiveness of your campaigns against industry averages, competitors, or your own past performance.
Think of them as the guardrails on the highway of social media advertising. They tell you if you're cruising in the fast lane or veering off toward a ditch. For a successful agency, mastering business social media marketing is about navigating this highway with precision.
For an agency, these numbers are more than just trivia for your next marketing meetup. They are your secret weapon for:
Pro Tip: There are three main types of benchmarks you should be tracking.
Here's where most guides fall short. They give you organic stats or paid stats, but never in the same place. As an agency, you know that's not how the world works. A client's performance is a blend of both, and your reporting needs to reflect that.
So, we've combined them.
Facebook is still a dominant force, but the kingdom is changing. While some brands are posting less, the real shift is toward quality over quantity. A recent Sprout Social study found that brands post about 9.5 times per day across all platforms, but the ones winning are focusing on making each post count.
For agencies, the key takeaway is that a strong paid strategy is essential to amplify high-quality organic content. If a client's organic engagement is high, it's a perfect signal to put ad spend behind that post. Using the right Facebook marketing tools can help you identify these opportunities automatically.
Instagram is a tale of two formats: Reels and everything else. While the overall organic engagement rate has seen a dip to 0.45 that number is seriously misleading.
Why? Because Reels are dominating, accounting for over 46% of time spent on the platform, according to Guru Focus. If your agency isn't creating Reels for clients, you're missing a massive engagement opportunity.
The lower paid CTR compared to Facebook tells us that creative matters even more here. Users expect visually stunning, native-looking ads, not generic banners.
If Instagram is the cool older sibling, TikTok is the life of the party. With an average organic engagement rate of 2.50%, according to Marketing Insights, it's a powerhouse for brand awareness and community building, especially for D2C brands.
Key metrics here go beyond likes. You need to be reporting on:
For agencies, the challenge isn't just making TikToks; it's integrating them into a full-funnel strategy.
Don't sleep on LinkedIn, especially for your B2B clients. This isn't just a resume site anymore. It's a content and community hub, and the numbers prove it. The average organic engagement rate has skyrocketed to an incredible 8%, as reported by Buffer.
This platform is a goldmine for establishing thought leadership, generating high-quality leads, and building professional communities. If your B2B clients aren't active on LinkedIn, you're leaving a massive opportunity on the table.
Broad benchmarks are great, but your fashion client doesn't care how a SaaS company is performing. To truly become a strategic partner, you need to speak their language and use their numbers.
Niche-specific data turns you from a generalist agency into a specialist.
For e-commerce, it all comes down to paid performance. Clicks and conversions are the name of the game. Here's how paid ad CTR breaks down across key e-commerce verticals, according to Lebesgue:
Beyond CTR, the metrics your e-commerce clients really care about are:
When you can walk into a meeting and say, "Our campaigns for you are hitting a 1.9% CTR, beating the apparel benchmark of 1.71%, which is driving a 4.5x ROAS," you've just made a powerful case for renewing your retainer.
Okay, you've got the data. Now what? Data is useless unless you use it to tell a story and drive action. Here's how top agencies turn benchmarks from a simple metric into a client retention and growth tool.
First things first: stop sending data dumps. Your clients are busy; they don't have time to decipher a spreadsheet with 50 columns, which is where dedicated PPC reporting software can be a game-changer.
The single most effective change you can make to your client reporting is adding one simple column: "Industry Benchmark."
Pro Tip: When a metric is below benchmark, don't hide it. Frame it as a "strategic opportunity for growth." Present the benchmark data, your diagnosis, and your action plan. This turns a potential negative into a showcase of your agency's proactive problem-solving skills.
Madgicx’s One-Click Report and Business Dashboard helps agencies streamline this process by providing ready-to-use reporting templates that automatically pull in connected performance data from ad platforms and analytics sources.
Instead of manually recreating tables, charts, and summaries, agencies can use these templates to:
This allows reporting workflows to scale as your agency grows—without adding administrative overhead.
Try our instant reports for free.
Use benchmarks as the foundation for setting KPIs. Instead of pulling a goal out of thin air ("Let's aim for a 3x ROAS!"), you can build a data-backed plan.
For example: "The industry benchmark for ROAS in your sector is 3.5x. For the first 90 days, our goal is to meet that benchmark. In the following 90 days, our goal is to exceed it by 15% by optimizing creative and audiences."
This approach manages expectations, demonstrates your expertise, and sets you up for a clear win.
This is a powerful strategy. Let's say you manage a client's Facebook and Instagram ads, and you're crushing it. But you notice their organic TikTok presence is non-existent, and the industry benchmarks show a massive engagement opportunity there.
You can go to them and say: "We're exceeding benchmarks on Meta, which is fantastic. Our analysis shows a significant opportunity on TikTok, where the average engagement rate is 2.50%. We propose a 3-month pilot program to establish your presence there and capture this audience. Here's what it would look like."
You've just used data to create a new revenue stream for your agency, and it feels like a strategic partnership, not an upsell. This is how you grow accounts.
It happens to the best of us. You run the numbers, and your client's metrics are... well, not great. Panic sets in. What do you tell the client?
Don't sweat it. This is your moment to shine and show your true value as a problem-solver. Here's your AI-powered action plan.
Before you touch a single campaign, you need to diagnose the 'why.' Is it creative fatigue? Audience saturation? A broken link? Guessing is slow and expensive.
This is where a tool like Madgicx's AI Chat becomes your diagnostic partner. Instead of spending hours digging through Ads Manager, you can simply ask:
"Why is my CTR for the 'Summer Sale' campaign lower than the 1.7% benchmark for apparel?"
In seconds, AI Chat performs a detailed ad analysis on your performance data and gives you a clear diagnosis. It might tell you, "Your frequency is over 4.5, suggesting ad fatigue," or "Your outbound CTR is high, but your landing page conversion rate is low, indicating a potential issue with the product page." You get actionable insights quickly.
If the diagnosis is creative fatigue (and let's be honest, it often is), you need fresh ads, fast. You can't afford to wait two weeks for a new batch of creative from a designer.
The AI Ad Generator is built for this exact scenario. You can generate dozens of new image ad variations in minutes. Test new hooks, different backgrounds, and fresh layouts to find a new winning combination that can help you improve performance and beat the benchmark.
Once you have new creative in the mix, you need to ensure your budget is working as hard as possible. Instead of manually checking performance every few hours, you can use an AI-powered optimization tool to do the heavy lifting.
The AI Marketer works 24/7 to help prevent wasted ad spend. It analyzes performance against your KPIs and provides one-click recommendations to shift spend away from underperforming ads and toward the winners. It's like having a junior media buyer who never sleeps.
The best agencies don't just meet benchmarks; they shatter them. Their secret? They don't try to do everything manually. They combine their strategic expertise with a powerful paid social media management tool to create a significant competitive advantage.
AI-driven advertising campaigns have the potential to deliver significantly higher ROAS and a lower CPA compared to manually managed ones. This isn't about replacing strategists; it's about empowering them.
We see it every day with agencies using Madgicx. They're not just hitting goals; they're turning "average" client accounts into their best case studies. For example, we've seen agencies achieve exceptional results, like a 30x ROAS for new e-commerce clients, by combining their strategic insights with Madgicx's AI-powered recommendations.
Pro Tip: Position AI tools to your team not as a replacement, but as a force multiplier. Madgicx allows your junior media buyers to access senior-level insights, freeing up your senior strategists to focus on high-level growth, client relationships, and scaling the agency. It's how you scale without massively increasing headcount.
It varies widely! For a quick reference, a good organic engagement rate is around 3.6% on Facebook (Social Champ), 8.01% on LinkedIn (Buffer), and 2.50% on TikTok (BlinkCopy). However, for the most accurate picture, you should look at the specific benchmarks for your client's industry, as discussed in our industry section above.
While the trend shows brands posting around 9.5 times per day across all platforms, according to Sprout Social, the real answer is: quality over quantity. It's better to post three high-impact pieces of content per week than ten mediocre ones that get no traction.
Don't panic! The first step is always diagnosis. Use a diagnostic tool like Madgicx's AI Chat to get a quick analysis of what's going wrong. From there, you can follow the AI-powered action plan to address the specific issue, whether it's creative, audience, or budget allocation.
Manually tracking this in spreadsheets is a recipe for burnout. An effective way is to use a centralized dashboard like the Madgicx Business Dashboard. It gives you a single view of all client performance, allowing you to monitor KPIs and benchmarks in one place without switching between a dozen tabs.
So, there you have it. You're now armed with the 2026 data, a framework for using it in client reports, and an AI-powered plan to not just meet, but beat the averages.
The next time a client asks, "But are these results good?" you won't feel a pit in your stomach. You'll smile, flip to the slide with the benchmark column, and confidently show them exactly how much value your agency is delivering.
Here are the key takeaways:
Your next step is simple. Take one client report for your next meeting and add a "Benchmark" column next to their key metrics. Use it to frame your agency's performance and strategic value. Watch how it changes the conversation.
Ready to streamline your reporting and focus on strategy? Try Madgicx free today.
Tired of manually pulling data from Meta, Google, and TikTok for client reports? Madgicx consolidates all your clients' cross-channel data into a single, shareable view with our One-Click Report and Business Dashboard. Stop wrestling with spreadsheets and start showing your strategic value.
.avif)
Digital copywriter with a passion for sculpting words that resonate in a digital age.