Think Your Ad Strategy Still Works in 2023?
Get the most comprehensive guide to building the exact workflow we use to drive kickass ROAS for our customers.


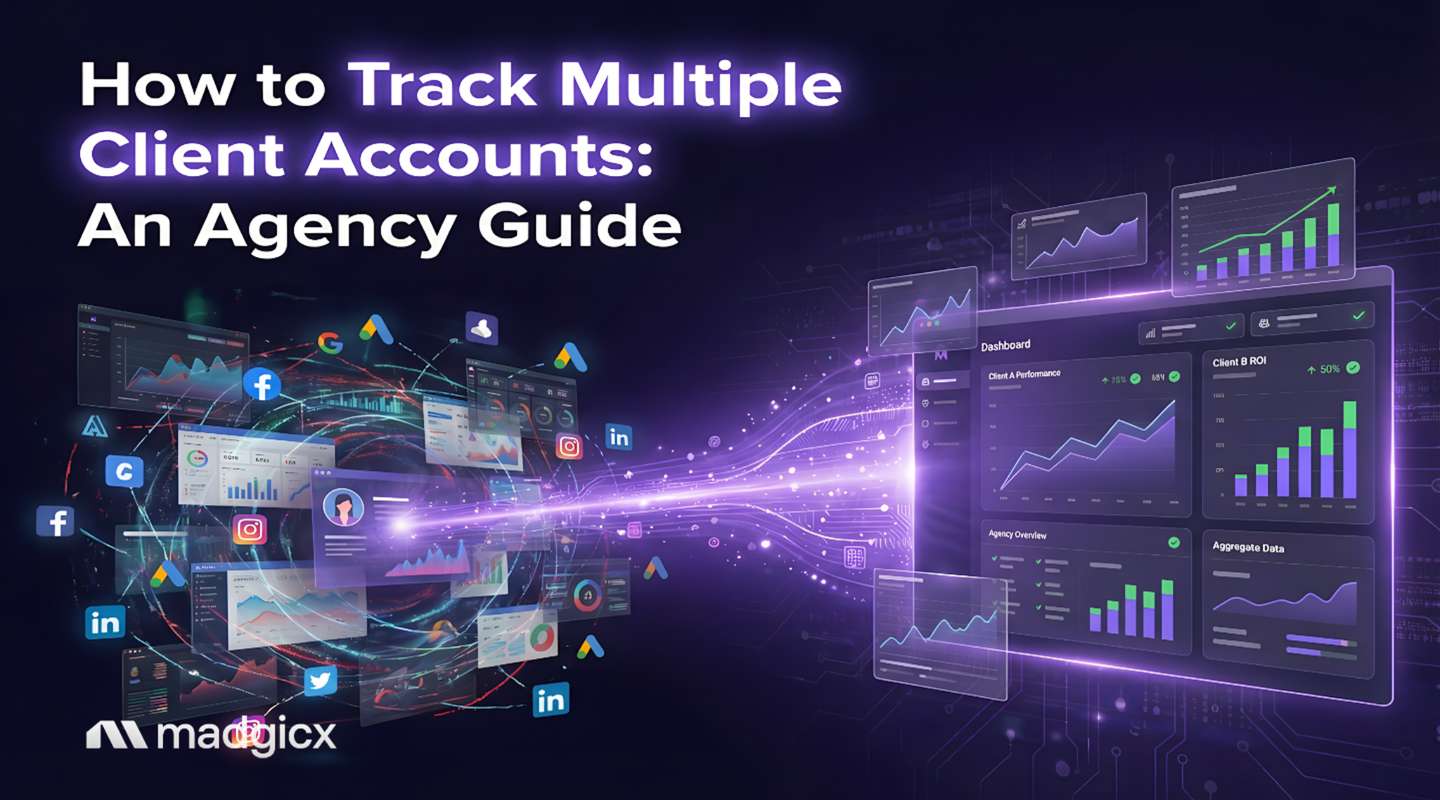
To track performance across multiple client accounts, agencies use specialized multi-client reporting tools. These platforms automate data aggregation from sources like Meta, Google Ads, and GA4 into one central dashboard.
A winning strategy combines a powerful tool with a smart statistical method, like using median averages to avoid data skew from your biggest accounts.
Ever felt like you're drowning in a sea of spreadsheets, manually copy-pasting data until your eyes glaze over? Sound familiar? If so, you're not alone. We've all been there, and it's one of the biggest headaches for agency account managers.
As digital marketing consultant Keith Moehring once said, "By the time you get your data compiled, it's already outdated." It's a painful truth. This manual grind isn't just slow; it's a recipe for burnout, client frustration, and missed opportunities hiding in plain sight.
But what if you could get all that time back? We're here to help you fix that. In this guide, we'll break down the best tools for tracking multiple clients, compare their (sometimes confusing) pricing, and give you a step-by-step workflow to build a system that scales, impresses clients, and frees you up for the strategic work you actually love.
Let's be honest, that "master spreadsheet" you built was a work of art... for about five minutes. Then you signed client number four, and it became a monster. Manual tracking with spreadsheets might feel productive for one or two clients, but it completely collapses as your agency grows.
Here's why it's a losing battle:
Trying to scale an agency on manual reporting is like trying to win a Formula 1 race on a bicycle. You'll pedal furiously, sweat buckets, and still get lapped.
The answer isn't a more complex spreadsheet or hiring a data-entry intern (trust us). The real solution is a dedicated multi-client reporting platform.
So, what is it exactly?
Multi-client reporting is the process of consolidating performance data from various advertising and analytics platforms for numerous clients into a single, unified view.
Think of it as your agency's mission control. Instead of logging into a dozen different platforms, you have one central hub that pulls everything together automatically. It's a game-changer.
The benefits are immediate and transformative:
Alright, so you need a tool. But here's the thing: not all tools are created equal.
While many platforms can pull in data, Madgicx was designed by and for performance-focused agencies and e-commerce brands. We don't just want you to see data—we want you to act on it.
Our One-Click Report and Business Dashboard are the core of our analytics suite. But what really sets Madgicx apart is how we connect reporting to the rest of your advertising workflow.
Here are our key differentiators, explained like a friend would:
1. Unified E-commerce View: Most reporting tools stop at ad platforms. That's only half the story! Madgicx natively integrates your ad performance (Meta, Google, TikTok) with your e-commerce and retention data (Shopify, Klaviyo). This lets you see the full picture, from first click to lifetime value, all in one place.
2. Beyond Reporting - Actionable Insights: A dashboard tells you what happened. But what about why it happened and what to do next? That's where our AI Chat comes in. Think of it like a senior media buyer on call 24/7. You can literally ask, "Why did my ROAS drop last week?" and it will analyze your account and give you a specific, actionable diagnosis. It's a powerful combo of reporting and action.
3. Creative + Optimization + Reporting: We designed Madgicx to close the loop. You can use our AI Ad Generator to create ad creative, use our AI Marketer to get optimization recommendations, and then track the results in your dashboards. It's a comprehensive, end-to-end advertising intelligence platform.
Now that we've established why you need a centralized tool, let's talk about which one to choose. There are tons of tools out there, and each has its own strengths and weaknesses. We'll break down some of the market leaders so you can make an informed decision that fits your agency's unique needs.
Here's the reality: picking the right reporting tool isn't just about features. It's also about how each platform handles pricing and how it scales with your agency. Some charge per client (ouch), others per data source, and some use tiered pricing based on your monthly ad spend. Knowing these details before you commit is critical.
Best For: E-commerce-focused agencies and brands managing Meta, Google, and TikTok advertising alongside platforms like Shopify and Klaviyo.
Key Features:
Pros:
Cons:
Pricing: Starts at $45/mo. Pricing is based on features and ad spend tiers, not per client. This makes Madgicx highly scalable for agencies managing multiple accounts.
Try Madgicx’s 7-day free trial here.
Best For: Full-service marketing agencies that manage a wide variety of channels (SEO, PPC, social, email, etc.) and need white-label reports for all of them.
Key Features:
Pros:
Cons:
Pricing: Starts at $12/month per client. Volume discounts apply at higher tiers, but cost can scale quickly if you're managing many clients.
Best For: Large agencies (50+ clients) looking for an enterprise-grade reporting and workflow management solution.
Key Features:
Pros:
Cons:
Pricing: Custom pricing based on agency size, integrations, and features. Typically starts around $499/month and scales up significantly for larger operations.
Best For: Small agencies, freelancers, or in-house teams looking for a simple, budget-friendly reporting tool.
Key Features:
Pros:
Cons:
Pricing: Free for up to 3 data sources. Paid plans start at $59/month for 10 data sources and scale upward as you add more.
Best For: Agencies or in-house teams that already use Google Sheets, Data Studio, or a data warehouse like BigQuery or Snowflake.
Key Features:
Pros:
Cons:
Pricing: Starts at $19/month per data source for Google Sheets/Data Studio. Higher tiers for data warehouse destinations (BigQuery, Snowflake) start around $199/month.
Best For: Agencies that want to create clean, simple reports quickly without fussing over complicated dashboards.
Key Features:
Pros:
Cons:
Pricing: Starts at $42/month for 3 dashboards. Volume discounts apply for larger packages (e.g., 25 dashboards for $199/month).
Alright, now that you've got your data flowing into a centralized tool, here's a question that separates the pros from the amateurs: How do you calculate your agency's overall performance without lying to yourself?
If you just average all your clients' metrics together, you're probably doing it wrong. Why? Because the simple mean (the regular average we learned in school) gets totally skewed by outliers.
Here's what we mean: Imagine you have five clients with the following ROAS values:
| Client | ROAS | Ad Spend | Revenue |
|---|---|---|---|
| Client A | 3.5 | $5,000 | $17,500 |
| Client B | 4.0 | $3,000 | $12,000 |
| Client C | 4.2 | $7,000 | $29,400 |
| Client D | 3.8 | $4,500 | $17,100 |
| Client E | 8.0 | $10,000 | $80,000 |
| Mean ROAS | 4.7 | $29,500 | $156,000 |
| Median ROAS | 4.0 | — | — |
Look at the ROAS. The mean (average) is 4.7, inflated by the huge success of Client E. The median is 4.0. Which number gives you a more honest picture of how a typical client is performing?
The median, every single time. It tells you the story of the client in the middle of the pack, protecting you from the false confidence (or panic) that outliers can create.
Pro Tip: Want to get even more advanced? Use a weighted average based on ad spend. This tells you the true, blended ROAS of your entire ad spend portfolio. Many advanced tools, including Madgicx, can calculate these blended metrics for you automatically.
Choosing a tool is step one. But implementing it effectively is what separates the pros from the amateurs. Here is our simple, 5-step workflow to get your new system running like a well-oiled machine.
Not all clients are the same, right? Before you build anything, segment your clients (e.g., VIP, Standard, Starter) and define the core Key Performance Indicators (KPIs) that matter for each. An e-commerce client cares about ROAS and CPA, while a lead gen client cares about CPL. Don't use a one-size-fits-all dashboard.
Using our comparisons above, choose the tool that best fits your agency's needs and budget. The first day should be all about connecting your data sources: every client's Meta Ads, Google Ads, GA4, Shopify, etc. Get all the raw materials into the system before you start building.
This is where the magic happens. Create two master templates:
1. The Agency Command Center (Internal): This is your dashboard. It should include roll-up reports using the median method for portfolio health, plus leaderboards showing top/worst performing clients so you know where to focus your attention.
2. The Client Report Card (External): This is the template you'll duplicate for each client. Keep it simpler, focusing only on the KPIs you defined in Step 1. If your tool supports it, this is where you'll apply white-label reporting.
What's that? White-label reporting simply allows an agency to customize reports and dashboards with its own branding, logo, and colors before sharing them with clients. It makes you look super professional.
This is how you turn your reporting tool into a proactive monitoring agent. Set up rules to get notified if a key metric goes off track. For example:
This lets you spot problems and fix them before the client even has a chance to notice. It's a huge trust-builder.
Pro Tip: Go beyond simple alerts. Set up client-specific performance benchmarks based on their historical data. An alert for a brand new client might trigger at a 15% CPA increase, while a stable, long-term client's alert might trigger at just 5%. This customizes your monitoring and makes it way more effective.
A dashboard is useless if no one looks at it. Mandate a weekly reporting review in your team meetings. Each account manager should pull up their client dashboards and discuss three things: a win, a challenge, and an action item for the upcoming week. This creates a culture of accountability and data-driven decision-making.
There's no single answer, but costs vary widely based on the tool's billing model. Some tools charge per client, while others have spend-based tiers or charge based on the number of data sources you connect. Review the pricing models in our guide to find a tool that aligns with your agency's growth and budget.
Honestly, with a good tool, you can get up and running faster than you think. You can expect to connect all your data sources and build your first dashboard templates within a single business day. Migrating 10-15 clients, including customizing their individual reports, can typically be done in 2-3 days.
Great question! A standard dashboard usually shows data for a single client or a single platform. Roll-up reporting is a specific feature that pulls data from multiple client accounts into one consolidated view. It lets agency owners see portfolio-level trends without having to check each client one by one.
Yes, absolutely! This is a pro move. You can create an internal-only dashboard to track agency-wide metrics like total ad spend managed, blended ROAS across all clients, total revenue generated for clients, and even team performance by tracking metrics for the accounts each manager is responsible for.
Once you hit 50+ clients, scalability and powerful roll-up features are non-negotiable. Tools like Madgicx, AgencyAnalytics, and TapClicks are built for this scale. Madgicx is your best bet if your clients are primarily in e-commerce. AgencyAnalytics is a strong generalist, while TapClicks is the enterprise choice for maximum connectivity.
Switching from manual spreadsheets to an automated, multi-client reporting platform isn't just a "nice-to-have" upgrade. It's a fundamental requirement for scaling a modern advertising agency. It's the difference between being a reactive data janitor and a proactive strategic partner for your clients.
By choosing a tool that not only aggregates data but also provides a unified e-commerce view and actionable AI insights—like Madgicx—you're not just saving time. You're building a competitive advantage. You're giving your team the intelligence they need to deliver better results, retain clients longer, and grow your agency with confidence.
Remember the key principles: automate everything you can, use the median to find the truth in your data, and build a consistent workflow. Now go reclaim those hours and start making magic happen.
Madgicx's One-Click Report and Business Dashboard are built to solve this exact problem. We consolidate data from Meta, Google, TikTok, GA4, Shopify, and Klaviyo into a single, beautiful dashboard. Get portfolio-level insights and save dozens of hours every single month.
.avif)
Digital copywriter with a passion for sculpting words that resonate in a digital age.