Facebook Ad Campaign Client Report Content That Builds Trust

Date
Jun 17, 2026
Jun 17, 2026
Reading time
10min
On this page
Facebook Ad Campaign Client Report Content

Master Facebook ad campaign reporting with our expert guide. Learn to create insightful client reports, track key metrics, and demonstrate ROI effectively.

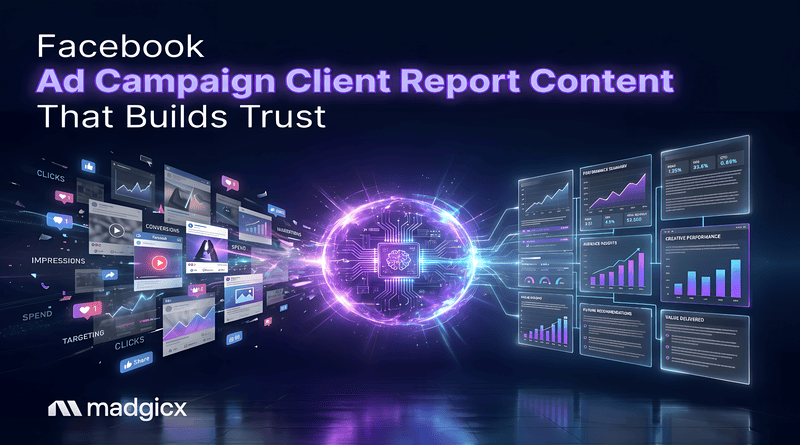
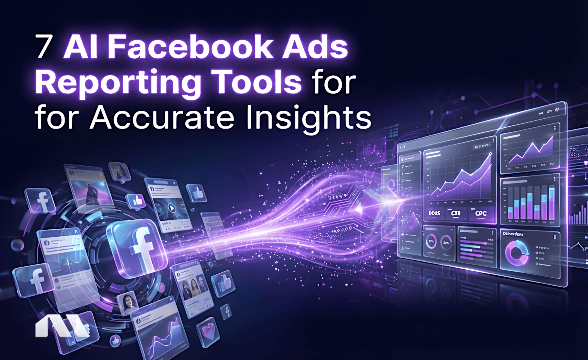
As an agency or freelancer managing Facebook ad campaigns for clients, delivering clear, insightful, and impactful reports is paramount. It's not just about showing numbers, it's about demonstrating value, proving ROI, and building trust. A well-crafted client report can be your secret weapon for client retention and growth.

But what exactly should go into a Facebook ad campaign client report? How do you move beyond raw data to provide actionable intelligence? This guide breaks down the essential components and best practices for creating reports that truly impress and shows how the right tools can make the whole process significantly faster. For a broader look at how AI is changing the way agencies manage and report on campaigns, see our guide to AI-powered campaign management for Meta ads.

What You'll Learn

  • Why client reports are one of your most powerful retention and growth tools
  • The 6 essential components every high-impact Facebook ad report needs
  • Best practices for report delivery that set professional agencies apart

Why Your Client Reports Matter More Than You Think

Before diving into the "what," let's quickly touch on the "why." Your client reports are more than just a formality:

  • They demonstrate value beyond the work itself. Clients who understand the results you're driving are far less likely to churn. 46% of agencies say proactive communication and transparency are one of the top factors in their client retention strategy.
  • They position you as a strategic partner, not just a service provider. A report that includes analysis, context, and forward-looking recommendations signals that you're thinking about the client's business, not just executing tasks.
  • They create a documented record of progress and decisions. This protects both parties, sets clear expectations, and gives you a paper trail when scope creep or performance disputes arise.
  • They build trust through transparency — especially during difficult periods. Underperformance handled with honest analysis and a clear recovery plan strengthens relationships. Silence or spin destroys them.
  • They open the door to upsells and expanded scope. A well-structured report naturally surfaces new opportunities — untested audiences, underserved budget allocations, or adjacent channels — that create a natural conversation about doing more.

In essence, a great report transforms data into a compelling narrative of success and strategic direction.

Essential Components of a High-Impact Facebook Ad Client Report

While every client and campaign is unique, certain elements are non-negotiable for a comprehensive and effective report.

1. Executive Summary: The Snapshot View

This is arguably the most important section, especially for busy clients. It provides a high-level overview of the campaign's performance during the reporting period — the "too long; didn't read" version that still conveys the critical information. Keep it to one paragraph or a tight bullet list. This sets the stage for the detailed data that follows.

  • Period highlights: the top-performing campaigns, biggest wins, and any notable shifts in performance
  • Overall spend vs. budget: are you pacing correctly and deploying the full allocation efficiently?
  • Primary KPI performance vs. goal: ROAS, CPA, lead volume, or revenue — how did the period land against targets?
  • One key strategic note: a single forward-looking observation or recommendation that demonstrates you're already thinking about the next period

Madgicx's One-Click Report turns cross-channel performance data into client-ready reports with executive summaries, KPI breakdowns, and performance insights. Choose from prebuilt templates, customize them with a drag-and-drop editor, and apply your agency branding to deliver a consistent, professional reporting experience that reinforces client trust. Start your free trial.

2. Campaign Overview & Goals: Context is King

Remind the client of the campaign's purpose before presenting any numbers. This section provides the context that makes performance data meaningful rather than abstract.

  • Campaign objective: awareness, traffic, conversions, lead generation, retargeting — and why this objective was chosen
  • Target audience and funnel stage: who the ads were shown to and where those audiences sit in the purchase journey
  • Reporting period dates and total budget allocated
  • Agreed KPIs and targets set at campaign outset: this anchors the performance data to the original brief
  • Significant changes made during the period: creative refreshes, audience updates, budget adjustments, bidding strategy changes — clients need to understand what changed and why

3. Performance Metrics: The Core Data

This is where you dive into the numbers. Organize your metrics logically, either by campaign objective or funnel stage, and use tables and charts for clarity. For a deeper look at which metrics matter most and how to interpret them, see our guide to Meta analytics.

Key metrics to include:

  • Impressions, reach, and frequency — with frequency flagged if it's approaching fatigue thresholds
  • Click-through rate (CTR) and link clicks — benchmarked against the Meta cross-industry average of 0.9–1.5%, according to PengWing.
  • Cost per click (CPC) and cost per result (CPR) — tracked against goal and prior period
  • Conversion rate and total conversions by type
  • Cost per purchase or cost per lead — the metric your client cares most about
  • Return on ad spend (ROAS) — with revenue attributed where trackable
  • Amount spent vs. budget pacing
  • Meta's ad relevance diagnostics: quality ranking, engagement rate ranking, and conversion rate ranking
Pro Tip: Don't just list numbers. Compare them to previous periods, benchmarks, or client goals. Highlight significant changes with directional indicators and brief explanations. A number without context is noise; a number with context is insight.

4. Ad Creative & Audience Insights: What's Working (and What's Not)

Clients are often deeply curious about the actual ads running on their behalf. This section brings creative and targeting performance to life — and demonstrates the analytical depth they're paying for.

  • Top-performing creatives by CTR, conversion rate, and ROAS — with ad thumbnails where possible so clients can connect the data to what they actually saw
  • Underperforming creatives that were paused and a clear explanation of why — this shows proactive management, not reactive firefighting
  • Audience segment performance breakdown: custom audiences vs. lookalikes vs. interest-based targeting, with conversion rates and CPAs for each
  • Frequency by ad set — flagging any creatives approaching fatigue thresholds so the client understands why a refresh is being recommended
  • Placement performance: Feed vs. Stories vs. Reels vs. Audience Network — where budget is working hardest and where it should be reallocated

Pulling this data manually from Meta Ads Manager is time-consuming and often incomplete. Madgicx's Creative Insights cuts through the noise by unifying your performance data into a clear picture of where your creative budget is actually earning its place — what's driving revenue, what has room to scale, and what's quietly draining spend without delivering results — so you always know which creative direction to push next.

5. Analysis & Recommendations: The "So What?"

This is where your expertise shines. Translating data into meaningful insights and actionable strategies is what separates a great agency from a reporting service. Avoid simply restating the numbers — clients can read the dashboard themselves. For a practical framework on how to approach this analysis, our guide on how to analyze Meta ads covers the methodology in detail.

  • What drove the strongest results this period and the likely contributing factors — audience quality, creative resonance, timing, or competitive dynamics
  • What underperformed and the likely cause — with honesty and a recovery hypothesis rather than vague reassurances
  • Creative fatigue indicators and a recommended refresh schedule with specific creative directions to test
  • Audience expansion or exclusion opportunities identified from the data — new lookalike seeds, suppression lists that should be built, or segments worth isolating
  • Budget reallocation recommendations for the next period based on where the strongest returns are coming from
  • Testing priorities for the next cycle: specific creative variants, audience hypotheses, or bidding strategies to validate

Using AI to automate part of the analysis process can dramatically reduce the time it takes to generate meaningful recommendations at scale. With Madgicx MCP for Claude, agencies can go beyond analysis and take action directly from their AI conversation—pulling live performance data, identifying underperforming campaigns, generating recommendations, and even making bid or budget adjustments without leaving the chat.

Our overview of the best AI tools to analyze Facebook ad reports covers the options worth considering.

6. Appendix (Optional but Recommended)

For clients who want to go deeper, an appendix provides the granular data without cluttering the main report.

  • Full campaign-level data tables for clients who want to verify figures independently
  • Ad-level performance breakdown with all active and paused creatives
  • Audience overlap analysis where relevant
  • Attribution model comparison — particularly useful for clients questioning Meta's reported conversions vs. what they see in GA4 or Shopify
  • Historical performance trend data showing trajectory over the last three to six months
TIP: Before every client meeting, running a Madgicx 360° Meta Audit gives you a complete account health snapshot — targeting efficacy, creative performance, auction dynamics, and demographic breakdowns — so your executive summary is built on a full picture, not just what Meta's dashboard surfaces by default.

Best Practices for Delivering Standout Reports

Beyond the content, how you present and deliver reports can make or break the client relationship. Agencies that automate their reporting can shave off hours per client per month — time that goes directly back into strategy and campaign work.

  • Establish a consistent reporting cadence — weekly, biweekly, or monthly — and stick to it. Consistency signals professionalism and reliability. Irregular reporting creates anxiety in clients, even when results are strong.
  • Tailor the depth to the audience. C-suite stakeholders need the executive summary. Hands-on marketing managers want the granular breakdowns. Have both ready and know which to lead with.
  • Lead with performance against goals, not raw numbers. "You achieved 125% of your ROAS target" lands better than "Your ROAS was 3.5x." Frame every metric relative to what was agreed.
  • Use visual formatting — charts, trend lines, color-coded status indicators — to make data scannable. Clients shouldn't have to work hard to understand their own results.
  • White-label your reports to reinforce your agency brand. Every client touchpoint is an opportunity to build professional credibility. Generic platform exports undermine the premium positioning most agencies are trying to maintain. See our breakdown of the best white-label reporting tools for agencies for the options worth exploring.
  • Send reports before the meeting, not during. Clients who've had time to review arrive with better questions, and the conversation is more strategic rather than spending the session reading through slides.
  • Automate wherever possible. Manually pulling, formatting, and assembling reports across multiple client accounts is one of the biggest drains on agency capacity. Tools that consolidate cross-channel data and generate reports automatically free your team to focus on the analysis layer that actually requires human judgment.

Frequently Asked Questions

How often should I send Facebook ad client reports?

It depends on campaign budget, client preference, and the pace of change in the account. Monthly reports work well for most clients and campaigns. High-spend accounts or clients who are more hands-on often benefit from weekly or biweekly updates, even if they're lighter in format. The key is consistency — agree on a cadence upfront and stick to it. Irregular reporting creates unnecessary anxiety regardless of how strong the results are.

What's the most important metric to include in a Facebook ad report?

It depends entirely on the campaign objective, but the metric that matters most is always the one tied to the client's actual business outcome — cost per purchase, cost per lead, or revenue attributed. Reach, impressions, and CTR are supporting metrics that provide context; they shouldn't be the headline. Always lead with the number that directly connects to the client's bottom line.

How do I handle a bad month in a client report?

Transparently and proactively. Clients discover underperformance eventually — whether you tell them or they find out themselves determines whether they trust you. Present the numbers honestly, provide a clear diagnosis of what drove the underperformance, and lead with a specific recovery plan rather than vague reassurances. An agency that handles a bad month well often retains the client for years. One that buries or spins bad results rarely does.

How can I make reporting faster without reducing quality?

Automation is the answer for the data assembly layer — pulling numbers, formatting tables, generating period-over-period comparisons. Tools like Madgicx's One-Click Report handle this automatically across all your connected channels, so your team's time goes entirely into the analysis and recommendations that require human judgment. The quality of a report isn't determined by how long it took to build — it's determined by the quality of the insights inside it.

Conclusion: Your Report, Your Reputation

Crafting effective Facebook ad campaign client reports is both an art and a science. It requires a deep understanding of the data, a clear communication strategy, and a genuine commitment to transparency — especially when performance doesn't go to plan.

By leading with an executive summary, providing meaningful context, presenting clear metrics with honest analysis, and offering forward-looking recommendations, you transform your reports from data dumps into powerful tools for client education, retention, and growth. Agencies that report well don't just retain clients — they earn the trust and budget that come with being seen as a strategic partner rather than a vendor.

Invest in the quality and consistency of your reporting, and your clients will notice. Try Madgicx's One-Click Report for free and see how much faster your team can get there.

Think Your Ad Strategy Still Works in 2023?
Get the most comprehensive guide to building the exact workflow we use to drive kickass ROAS for our customers.
There's a Quicker Way to Generate More Client Reports!

Madgicx's One-Click Report consolidates data from Meta, TikTok, Google, Shopify, Klaviyo, and more into a single report your team can generate in minutes. Customizable templates and full white-label options mean every report looks professional.

Start Your Free Trial
Date
Jun 17, 2026
Jun 17, 2026
Annette Nyembe

Digital copywriter with a passion for sculpting words that resonate in a digital age.

You scrolled so far. You want this. Trust us.