Think Your Ad Strategy Still Works in 2023?
Get the most comprehensive guide to building the exact workflow we use to drive kickass ROAS for our customers.


Tired of the "10 tabs open" nightmare every time a client asks for a performance update? Drowning in a sea of spreadsheets, trying to manually stitch together data from Meta, Google, and TikTok, only for the numbers to never quite match up?
We've all been there. And you're not alone. We get it. Many agencies hit a scaling wall, not because of a lack of clients, but because their reporting process is fundamentally broken. It's a time-consuming, error-prone cycle that keeps your best people bogged down in data entry instead of strategy.
And let's be honest, the data chaos is real. Research shows that, according to a Gartner survey, 76% of marketing leaders feel overwhelmed by the volume of data they receive. You have the data, but turning it into clear, actionable insights feels like a full-time job in itself.
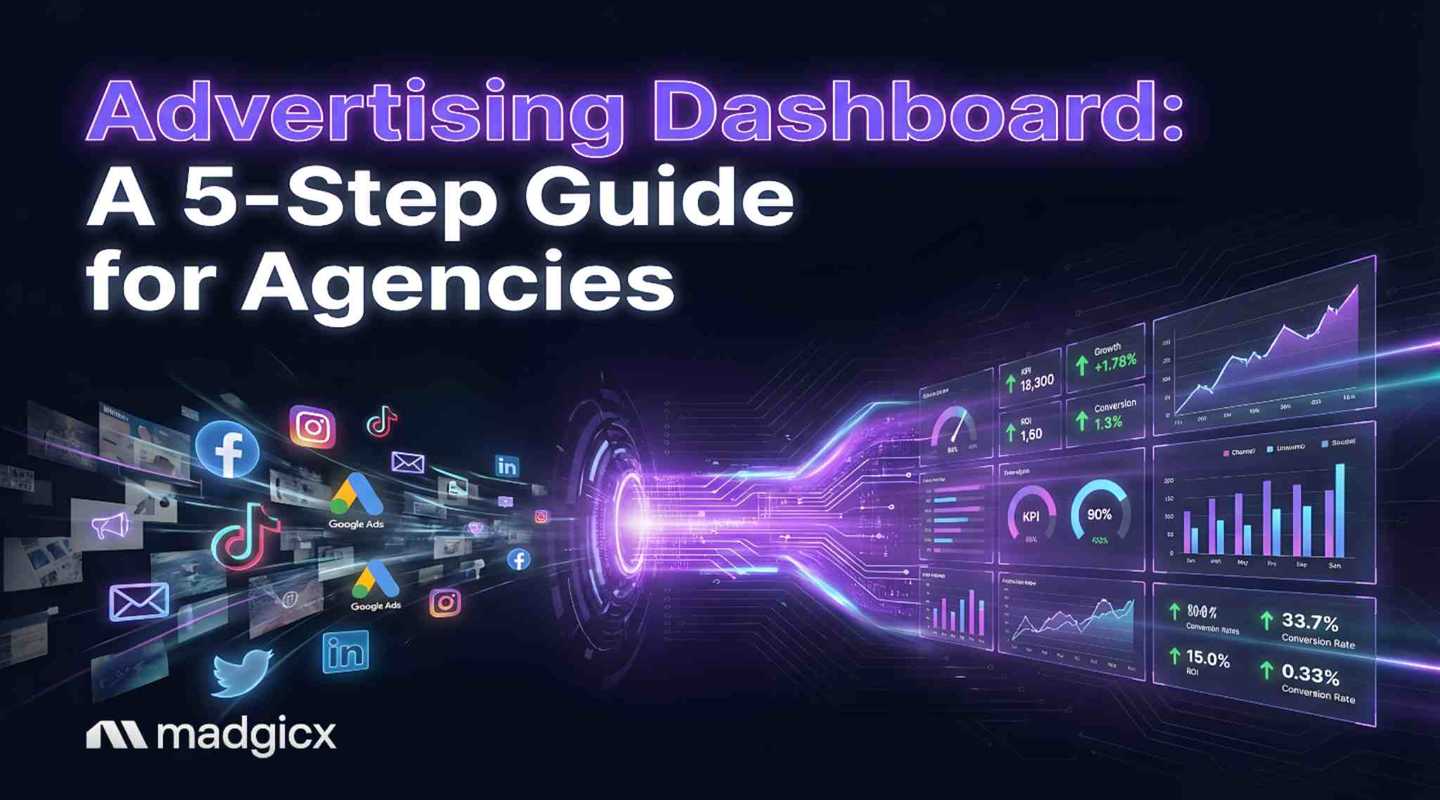
This article is your way out of that cycle. We're going to show you how to build a streamlined, actionable advertising dashboard that not only saves you dozens of hours a week but also provides the crystal-clear insights your clients love.
Let's start with a simple, direct definition. An advertising dashboard is a visual interface that pulls all your key performance indicators (KPIs) from various ad platforms into a single, unified view. For agencies, it's the mission-control center for monitoring all client accounts, campaigns, and channels at a glance.
But it’s so much more than a pretty chart. It’s your agency’s centralized source of truth.
Instead of jumping between Facebook Ads Manager, Google Ads, and your client’s Shopify store, you get a holistic view of performance in one place. This isn't just about convenience; it's about survival and growth. In a world where you're constantly battling for client attention and budget, a dashboard transforms your agency from a service provider into a strategic partner.
It lets you answer the most important client questions in seconds:
Without a centralized dashboard, answering these questions means hours of manual work, exporting CSVs, and wrestling with VLOOKUPs. With one, it’s a matter of seconds. ✨
Pro Tip: A great agency dashboard tells a story: where the budget went, what the return was, and what we should do next. It’s not just data; it’s a narrative that proves your value.
Alright, let's talk money. Investing time or resources into a proper dashboard system isn't a cost; it's a direct path to higher profitability. Here’s exactly how.
Think about the time your team spends every week and month just pulling reports. Now, what if you could slash that time and give it back to them? That’s what a dashboard does. It automates the tedious data collection, freeing up your account managers to focus on what you actually bill for: strategy, optimization, and scaling client accounts.
The impact is huge. According to industry analysis, businesses using centralized, real-time dashboards achieve 25% faster campaign decision-making and a 33% higher marketing ROI. Faster decisions mean less wasted ad spend and more time spent on revenue-generating activities.
Hiring is expensive and time-consuming. A well-built dashboard is a force multiplier for your team. It empowers even junior account managers to spot trends, identify underperforming ads, and make smart optimizations that would typically require senior-level oversight.
By standardizing your agency's "view" of success, you create a system where everyone can monitor account health effectively. This allows your senior strategists to focus on high-level client relationships and new business. You can take on more clients without your operational costs spiraling out of control.
Here's a hard truth: clients don't churn because of one bad campaign; they churn because of a lack of communication and perceived value. A transparent, easy-to-understand digital marketing dashboard is one of your most powerful retention tools.
When you can share a live link that clearly shows Spend, Revenue, and ROAS, you build immense trust. You’re not hiding behind confusing metrics; you’re giving them a clear window into their investment's performance. This transparency turns reporting sessions from defensive justifications into collaborative strategy meetings, solidifying your role as an indispensable partner.
Not all metrics are created equal. A cluttered dashboard is just as useless as a spreadsheet. A great dashboard organizes KPIs into layers, so you can show the right information to the right person at the right time.
Here’s the simple framework we use to keep things clean and actionable.
This is the top-line view for your clients. It should be dead simple, clean, and focused on business outcomes. No jargon, just results.
This is for your account managers. These metrics help them understand the why behind the Tier 1 results and diagnose performance issues before they become problems.
These are the granular metrics your team uses for in-the-weeds optimizations. They usually don't belong on a client-facing dashboard but are crucial for your internal team's day-to-day work.
Ready to build? Here’s a repeatable process your agency can use to get it right every single time.
First things first. Stop and ask the most important question: "What does success actually look like for this client?" Is it maximizing ROAS for an e-commerce store? Driving down cost per lead for a B2B service? Or acquiring new customers at a specific blended CPA?
The client's business objectives must define the dashboard's primary KPIs. Don't just copy and paste metrics from another account. Tailor the dashboard to tell the story that matters most to that client.
This is where the magic—and the potential for headaches—begins. You need to pull data from all the relevant platforms into one place. This typically includes:
Connecting these sources is what allows you to create that holistic view, blending ad performance with actual business results.
Don't just throw charts on a page and call it a day. Design with a purpose. A proven layout for agencies is:
Remember: garbage in, garbage out. For your dashboard to be trustworthy, your data needs to be clean. This means establishing agency-wide best practices for:
The final step is to get yourself out of the manual work. A truly efficient system has data that refreshes automatically. You can then share a live dashboard link with your client for real-time updates or schedule a PDF to be sent for your weekly reports. This is how you achieve true reporting nirvana. 🚀
Okay, so how do you actually make this happen? Agencies generally face two choices: build it yourself or buy a ready-made solution.
| Approach | The “Build” (DIY) Approach | The “Buy” (All-in-One) Approach |
|---|---|---|
| Tools |
Supermetrics / Porter Metrics + Looker Studio / Power BI |
Madgicx, AgencyAnalytics, Whatagraph |
| Pros |
✅ Ultimate customization and flexibility. |
✅ Incredibly fast setup (minutes, not weeks). |
| Cons |
❌ Time-intensive; requires technical expertise. |
❌ Less customization than a full BI tool setup. |
| Best For |
Agencies with dedicated data analysts. |
Agencies focused on speed, efficiency, and scalability. |
Pro Tip: If your agency has a dedicated data analyst on staff, the "Build" approach offers maximum flexibility. For most agencies focused on speed and efficiency, the "Buy" approach is the smart shortcut—it provides 90% of the value for 10% of the effort.
Here's how we see it: for most performance-focused agencies, an all-in-one platform is the winning move. This is where Madgicx shines. We built the One-Click Report and Business Dashboard specifically to solve this exact problem.
It’s not just a reporting tool; it’s part of a comprehensive advertising platform. You get the fast, multi-channel reporting you need—integrating Meta, Google, TikTok, GA4, Shopify, and Klaviyo—without the DIY headache. The real power is that the insights from your dashboard are directly connected to our AI-powered optimization tools. You can go from insight to action, all within the same platform, which is the core promise of AI-driven advertising.
Try our inclusive dashboard here.
If you've ever had a client ask, "Why does Facebook say we made $10,000 but Shopify only shows $6,000?"—this section is for you. This is the single biggest source of friction in client reporting.
It's not that one platform is "lying." It's that they all measure success with a different rulebook.
Here's the secret: stop trying to make the numbers match perfectly. It's an impossible, frustrating task. Instead, use your dashboard to create a blended, directional source of truth.
The goal isn't perfect accounting reconciliation; it's consistent, trend-based decision-making. By combining data from all your ad platforms with your store's backend (like Shopify), you can calculate a Blended ROAS or Marketing Efficiency Ratio (MER). This becomes your North Star metric. As long as your blended ROAS is above target, your overall strategy is working, regardless of what any single platform claims.
A more accurate data foundation makes this whole process easier. This is where Madgicx's Server-Side Tracking comes in. By creating a more reliable server-to-server connection between your website and platforms like Meta, it helps address data loss from things like iOS updates. More accurate data leads to better optimization and more reliable numbers in your dashboard to begin with, which is the primary function of a powerful Facebook Ads reporting tool.
Finally, a dashboard is only as good as its ability to communicate value. Here are a few pro moves to make your dashboards a client-retention machine.
Think of it as specific vs. broad. An advertising dashboard focuses specifically on paid media performance (PPC, social ads), tracking metrics like ROAS, CPA, and spend. A social media report or marketing dashboard has a wider scope that can include organic social, SEO, and email marketing.
Best practice is to have a detailed internal dashboard for each client and a simplified, summary version for client-facing reports. We also recommend a portfolio-level dashboard that gives you a top-level view of all clients at once, so you can see your whole agency's health at a glance.
While it always depends on the client's goal, ROAS (Return on Ad Spend) or POAS (Profit on Ad Spend) is typically the most critical KPI. It directly ties the advertising budget to business revenue and profitability—the thing your clients care about most.
Yes, you can use tools like Looker Studio with its native connectors for Google Ads and GA4. However, to connect data from platforms like Meta or TikTok, you'll need third-party connectors, which usually come with a monthly cost. So, a truly multi-channel dashboard is rarely ever free.
Building a robust advertising dashboard isn't just a technical task; it's a strategic move that unlocks your agency's ability to scale. By centralizing data, standardizing KPIs, and automating reports, you free your team to focus on high-impact strategy.
You move from being a reactive report-puller to a proactive growth partner for your clients. You'll be able to answer tough questions with confidence, prove your value with compelling data, and ultimately, build a more profitable and efficient agency.
Ready to ditch the spreadsheets for good? Madgicx's One-Click Report and Business Dashboard give you the cross-channel clarity you need, without the custom-build complexity.
Stop building reports and start driving results. Our unified One-Click Report dashboard combines data from Meta, Google Ads, TikTok, GA4, Shopify, and Klaviyo, letting you generate comprehensive, client-ready reports in a single click.
.avif)
Digital copywriter with a passion for sculpting words that resonate in a digital age.