Think Your Ad Strategy Still Works in 2023?
Get the most comprehensive guide to building the exact workflow we use to drive kickass ROAS for our customers.


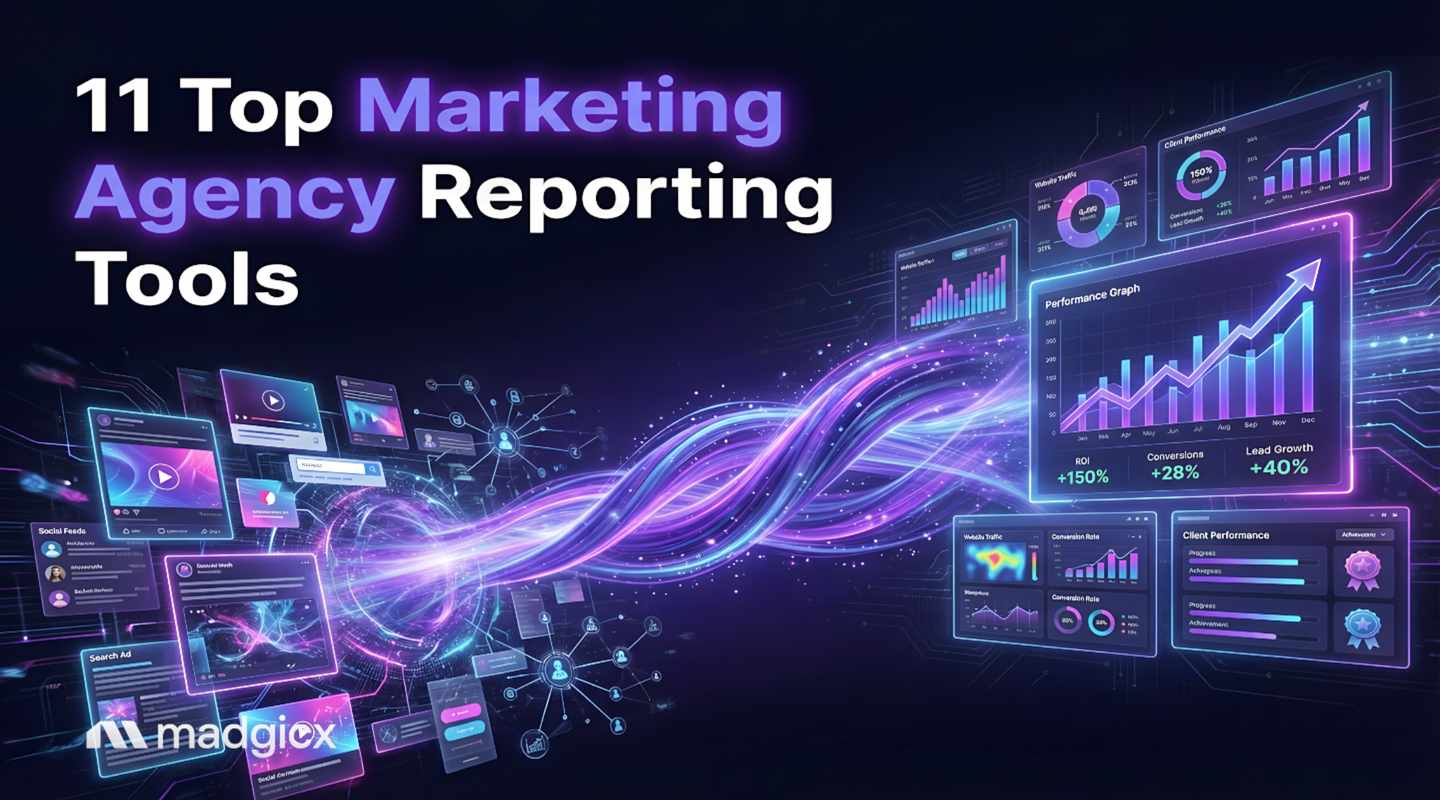
Let’s be honest: is there anything more tedious than building client reports? It’s the broccoli of agency life. You know effective client reporting is necessary, but it’s rarely the part of the job that gets you jumping out of bed in the morning.
In fact, marketing teams spend over 6 hours weekly on manual data compilation. For an agency juggling multiple clients, that can cost over $135,000 annually in wasted labor. Ouch. That’s time and money you could be spending on strategy, creative, and actually growing your clients' businesses.
But what if you could get that time back? This guide is your shortcut. We’ve done the heavy lifting, diving deep into the top 11 tools, with verified pricing, feature comparisons, and a clear framework to help you choose the right platform in under 15 minutes.
Choosing a reporting tool feels a bit like dating—everyone has a "type." So, how did we find the best matches for every kind of agency? We judged each platform on a set of non-negotiable criteria. We didn't just look at shiny features; we focused on what actually saves you time and helps you deliver more value, which is the core purpose of all good marketing analytics tools.
A reporting tool is only as good as the data it can pull. We looked for platforms with a wide range of native connectors to the platforms you use every day (Meta, Google, TikTok, Shopify, etc.). Quality matters, too. A connector that constantly breaks or pulls inaccurate data is worse than no connector at all.
Your reports are a direct reflection of your agency. You'll see the term "white-label reporting" thrown around a lot. In simple terms, it's the practice of applying an agency's own branding, including logos and color schemes, to reports generated by a third-party software tool, presenting them to clients as the agency's own. We prioritized tools that let you deliver professional, on-brand reports that look like you spent a week building them (when it really took five minutes). The goal is to produce a document that looks as polished as this client report example.
Here's the deal: the whole point of a reporting tool is to reduce manual work. We're talking about automated reporting, which is a feature that enables a tool to compile, format, and distribute marketing reports on a recurring schedule (e.g., daily, weekly, or monthly) without requiring daily manual compilation. We looked for robust scheduling, easy setup, and reliable delivery that you can set and forget.
This is where things get interesting. Simply showing data in a pretty chart isn't enough anymore. We looked for platforms that use AI to go a step further—diagnosing performance issues, providing actionable recommendations, and forecasting trends. This is the difference between a simple data aggregator and a true intelligence platform. 💡
Agency life is a rollercoaster. You need a tool that can grow with you without breaking the bank. We analyzed pricing models for fairness, scalability, and hidden fees. We favored tools with transparent pricing that doesn't punish you for adding a new client or data source.
You don't have time for a three-month implementation process. We measured how intuitive each platform is and estimated the "Time to First Report"—how quickly a new user can connect their data and generate a client-ready report. The faster, the better.
When a client report is due and a data source won't connect, you need help, and you need it fast. We evaluated the quality of customer support, the availability of onboarding resources, and the overall helpfulness of the team behind the tool.
Pro Tip: When evaluating tools, always use the free trial to connect your messiest client account. This will quickly reveal a platform's true data-handling capabilities and ease of use under real-world pressure.
Alright, let's get to the main event. We put these tools through the wringer so you don't have to. Here are the detailed breakdowns of the leading reporting platforms for your agency.
Overview: Madgicx is an AI-powered advertising platform built for performance-focused e-commerce marketing agencies. It doesn’t just show you data — it helps you understand why performance changes and what to do next.
Key Features:
Pros:
Con:
Who It’s NOT For: Agencies that need organic social media reporting without running paid ad campaigns.
Overview: AgencyAnalytics is the Swiss Army knife of agency reporting. It’s an all-in-one platform designed to make life easier for agencies managing a diverse portfolio of clients with needs spanning SEO, PPC, social, and more.
Key Features:
Pros:
Cons:
Who It's NOT For: Performance-heavy agencies that need deep, diagnostic insights into their ad campaigns. If your primary value is driving ROAS on Meta and Google, you may find its analytical depth limited.
Overview: Swydo strikes a great balance between functionality, ease of use, and affordability, making it a popular choice among freelancers and smaller agencies who need professional reporting without the enterprise price tag.
Key Features:
Pros:
Cons:
Who It's NOT For: Large agencies or those with complex, multi-channel clients that require a vast number of data integrations and deep customization.
Overview: Looker Studio is Google's free, powerful, and highly customizable reporting tool. Think of it as the IKEA of reporting: it's powerful and you can build almost anything, but you have to assemble it all yourself.
Key Features:
Pros:
Cons:
Who It's NOT For: Agencies that need an easy, all-in-one solution and don't have the time or technical resources to build custom dashboards from scratch. If "time to first report" is your main priority, look elsewhere.
Overview: Improvado is a serious, enterprise-level data platform for agencies managing huge volumes of data. It's less of a simple reporting tool and more of a marketing ETL (Extract, Transform, Load) solution designed to aggregate data from hundreds of sources into a single destination, like a data warehouse or BI tool.
Key Features:
Pricing: Custom Quote. Expect this to be one of the more expensive options, geared towards large agencies and enterprise clients.
Pros:
Cons:
Who It's NOT For: Agencies that aren't dealing with massive, complex datasets from dozens or hundreds of sources. This is for agencies with dedicated data teams who know what ETL means without Googling it.
Overview: TapClicks is another enterprise-grade player that combines data aggregation with a robust reporting and analytics suite. It's built for large agencies that need to manage reporting, orders, and workflow across a large team and client base.
Key Features:
Pros:
Cons:
Who It's NOT For: Small agencies, freelancers, or anyone looking for a simple, plug-and-play reporting solution.
Overview: WhatConverts is a hyper-focused tool that excels at lead tracking and reporting. It's designed for agencies whose clients live and die by the lead (think law firms, home services, B2B). It tracks calls, forms, chats, and transactions back to the specific marketing source.
Key Features:
Pricing: Contact for Quote.
Pros:
Cons:
Who It's NOT For: E-commerce agencies or anyone who needs to report on metrics beyond leads, such as ROAS, AOV, or customer LTV.
Overview: DashThis is a straightforward, no-fuss dashboarding tool that focuses on creating clean, attractive reports quickly. It’s a solid mid-market option for agencies that prioritize simplicity and aesthetics.
Key Features:
Pricing: Starts at $42/month for 3 dashboards, with agency plans starting at $135/month.
Pros:
Cons:
Who It's NOT For: Data-heavy agencies that need complex data blending, custom calculations, or deep analytical insights.
Overview: Reportz is a lean, mean, reporting machine for agencies and freelancers on a budget. It offers a simple, effective way to create white-labeled dashboards without any unnecessary bells and whistles.
Key Features:
Pricing: Contact for Quote.
Pros:
Cons:
Who It's NOT For: Agencies that need a wide range of data sources or advanced analytical features. It's a basic tool for basic needs.
Overview: Databox aims to make data accessible to everyone in the organization, not just analysts. It’s known for its mobile app and its focus on creating real-time dashboards that can be displayed on office TVs. 📺
Key Features:
Pros:
Cons:
Who It's NOT For: Agencies whose primary need is generating and automating pixel-perfect, white-labeled PDF reports for clients. Databox is built more for internal, real-time monitoring.
Overview: Supermetrics isn't a dashboarding tool itself; it's the engine that powers them. It's a data connector that pulls marketing data from any source and pipes it into your reporting environment of choice, whether that's Looker Studio, Google Sheets, or a data warehouse.
Key Features:
Pricing: Varies widely depending on the destination and data sources. Contact for a quote.
Pros:
Cons:
Who It's NOT For: Anyone looking for an all-in-one, plug-and-play reporting platform. Supermetrics is a component, not a complete solution.
Okay, decision time. The "best" tool is the one that fits your agency's specific DNA. Don't just pick the one with the most features; pick the one that solves your biggest headaches. Find your agency type below to get our top recommendation.
Pro Tip: Don't just buy the tool, buy the support. Before committing, ask a complex question to the support team during your trial. Their response time and quality will tell you everything you need to know about their customer service.
| Agency Type / Size | Recommended Tool | Why It’s a Fit |
|---|---|---|
|
E-commerce & DTC Marketing Agencies |
Madgicx | Provides instant AI diagnostics and cross-channel e-commerce analytics (MER, blended ROAS, etc.) needed to drive performance. |
|
Small Agencies (1–10 Clients) |
AgencyAnalytics | The all-in-one simplicity, broad integrations, and strong white-labeling make it perfect for managing a diverse client portfolio without complexity. |
|
Freelancers & Solopreneurs |
Swydo | Flexible per-source pricing makes it cost-effective when you're starting out, while still delivering professional, client-ready reports. |
|
Large Agencies (Custom Needs) |
Looker Studio + Supermetrics |
This combo offers ultimate flexibility to build fully bespoke dashboards for sophisticated clients — provided you have the technical resources. |
|
Enterprise (Data Warehousing) |
Improvado | When you need to aggregate data from hundreds of sources into a central warehouse for a BI team, Improvado is the purpose-built solution. |
|
Lead-Gen Focused Agencies |
WhatConverts | Excellent for tracking leads back to their true source, proving ROI for clients in industries like home services, legal, and B2B. |
Think of it this way: a marketing reporting tool is a specialist, like an orthodontist. It's designed for one specific job—automatically creating marketing reports with pre-built connections to platforms like Facebook Ads and Google Analytics.
A Business Intelligence (BI) platform like Tableau is a general surgeon. It's a much broader, more powerful tool for data analysts to explore huge, complex datasets from any part of a business (finance, operations, etc.) and build custom visualizations from scratch.
It really depends. With a user-friendly tool like Madgicx or AgencyAnalytics, you can connect your data and have your first client-ready report in under an hour. Seriously. But for a highly customizable platform like Looker Studio, you should probably block off your calendar. It could take 8-16 hours or more to build your first dashboard from scratch.
This is a great question. Data accuracy often comes down to the quality of the API connection. Tools like Madgicx, Improvado, and Supermetrics are known for their high-quality, reliable connectors because data integrity is their bread and butter. Madgicx takes it a step further by including its own server-side tracking solution to help improve the accuracy of the data being sent to platforms like Meta in the first place. Better data in means better data out.
Yes, but with a huge asterisk: only if the AI is actionable. Most "AI" in reporting is just basic anomaly detection ("Your CPC went up!"). An effective AI, like Madgicx's AI Chat, is designed to improve ROI by analyzing performance 24/7, diagnosing the root cause of problems (like creative fatigue or audience saturation), and giving you specific, data-backed recommendations on how to fix them. It saves you time and helps you stop wasting ad spend, fast.
Choosing a reporting tool is a bigger decision than it seems. It dictates how you spend your time, how you communicate value to clients, and ultimately, how effectively you can grow their business—and your own.
The era of static, data-dump reports is over. Your clients don't just want to see charts; they want to know what the data means and what you're doing about it.
While tools like AgencyAnalytics offer excellent simplicity for general-purpose agencies, Madgicx stands out for performance-focused e-commerce agencies that need more than just data visualization—they need actionable AI insights. It's a platform built to help you answer both "what happened?" and "what should I do now?" in one place. Stop building reports and start getting answers. Your time is too valuable to waste on spreadsheets.
Madgicx makes client reporting fast, flexible, and professional. Create branded reports, track cross-channel performance, and share live dashboards that stay updated automatically — so you can focus on growing accounts, not building slides.
.avif)
Digital copywriter with a passion for sculpting words that resonate in a digital age.