What Is Analytics Data? A Guide for Marketing Agencies

Date
Jan 20, 2026
Jan 20, 2026
Reading time
15 min
On this page
analytics data

Discover what analytics data is and how your agency can use it to drive client results. Learn the 4 types, find the right tools, and scale.

You know the feeling. It's 9 PM on a Tuesday, and you're staring at a spreadsheet that looks like a scene from The Matrix. You've got tabs for Meta, Google Ads, TikTok, and Shopify for a dozen different clients. Each one is a beautiful, chaotic mess of numbers.

Your clients are asking for ROI, your boss is asking for insights, and you're just trying to figure out the "so what?" behind a 0.2% dip in click-through rate. Sound familiar? We've all been there. Juggling multi-platform data is a universal agency-level headache.

But here's the thing: you're not just drowning in data; you're swimming in opportunity. The global data analytics market is expected to balloon to around $785.62 billion by 2035, and for good reason.

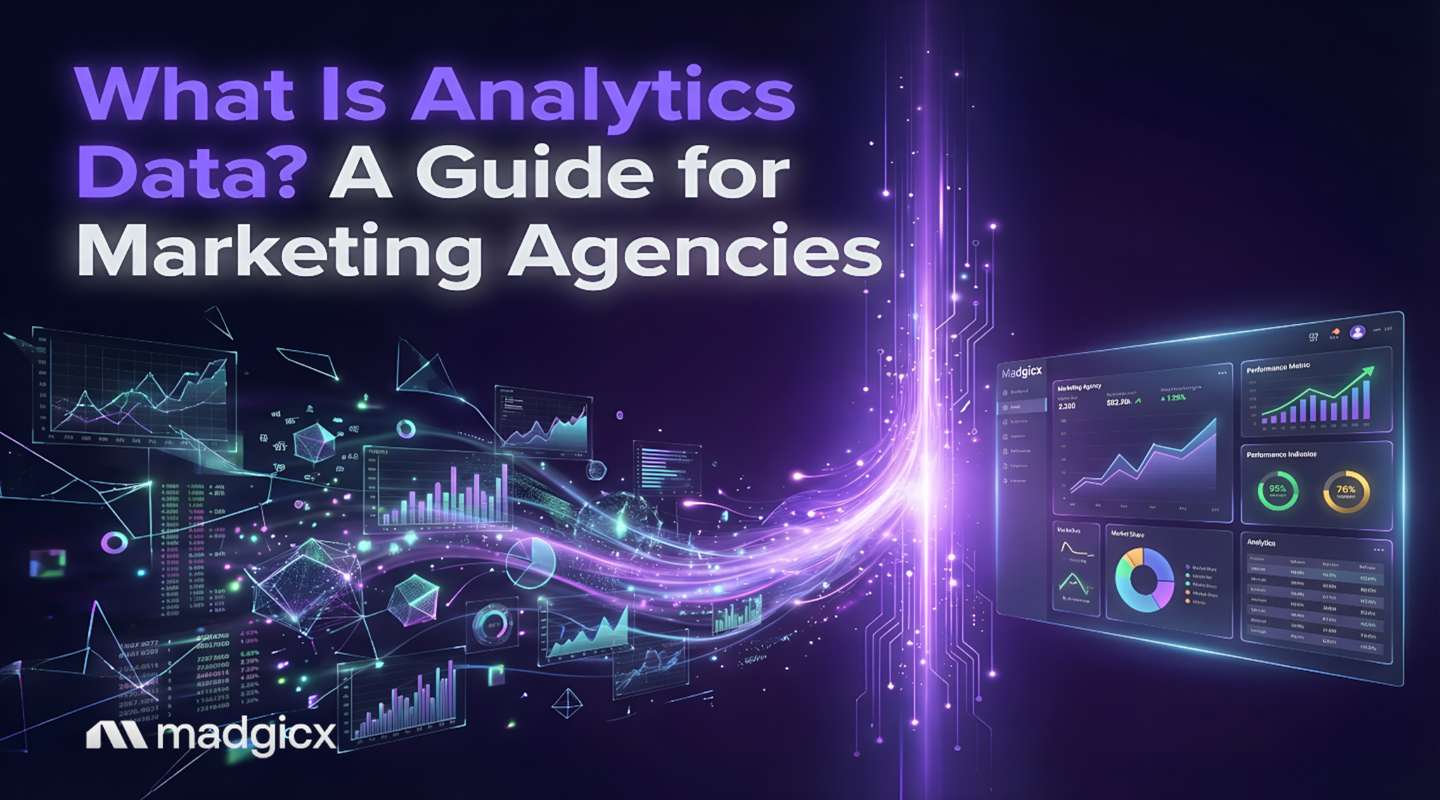
At its core, analytics data is the process of transforming raw performance metrics into actionable business insights. For agencies like yours, it's the secret weapon that turns you from a number-reporter into a strategic growth partner. It's how you stop justifying your retainer and start proving your strategic value, client after client.

So, take a deep breath and close that spreadsheet (for now). This guide is your lifeline. We're breaking down everything you need to know about analytics data, specifically for a busy marketing agency that wants to scale.

Here's what we'll cover together:

  1. The 4 types of analytics and how to apply them to your clients' Meta ad campaigns.
  2. A 5-step process for building a scalable analytics workflow for your agency.
  3. How to choose the right analytics tools (from free to enterprise) to save your team hours.

By the end, you'll know how to build scalable systems, make smarter decisions for your clients, and—dare we say it—actually enjoy looking at the numbers again.

Why Analytics Data is Your Agency's Superpower

Let's be honest: any agency can pull numbers from Ads Manager. A great agency tells the story behind those numbers. That's the power of analytics. It's what elevates you from a service provider who manages campaigns to a strategic partner who drives business growth.

When you master analytics, you stop having conversations about cost per click and start having conversations about market share and customer lifetime value. This is a complete game-changer for client retention.

A global survey found that 41% of business leaders don't understand their own data because it's too complex. When you become their translator, you become invaluable.

This isn't just about looking smart in meetings. It's about moving faster. According to recent data, 80% of enterprise leaders believe data access leads to quicker decisions. For an agency, that means spotting a failing ad to minimize wasted budget or identifying a winning creative and quickly scaling it to capitalize on the opportunity.

Pro Tip: Use analytics to create cross-client benchmarks. If you manage three e-commerce clients in the fashion vertical, you can anonymize and aggregate their data. When Client A hits a 4.5x ROAS, you now have a powerful, data-backed performance goal to set for Client B, showcasing your deep industry expertise. It's a killer move.

Here's how you can quantify that value for a client:

  1. Scenario: A client's Meta ads are generating revenue, but their ROAS has been stuck at 2.5x for weeks.
  2. Action: You perform a diagnostic analysis and find that 80% of their budget is going to a single, saturated lookalike audience (think high frequency, low CTR).
  3. Optimization: You reallocate that budget to two new interest-based audiences your analysis flagged as high-potential.
  4. Result: The new audiences could hit a 4.0x ROAS. The overall account ROAS could climb to 3.8x, potentially delivering a huge revenue increase from the exact same ad spend. That's how you demonstrate clear, data-driven value.

The 4 Types of Analytics Data (And How to Use Them for Clients)

Okay, let's get into the nitty-gritty. Analytics isn't just one thing; it's a spectrum of understanding, from looking in the rearview mirror to predicting the future. Mastering these four types will equip you to answer any question a client throws at you.

1. Descriptive Analytics: "What Happened?"

This is the foundation of all analytics—the "what" of your data story. Descriptive analytics summarizes raw data into something digestible. Think of your go-to dashboards and monthly reports.

  • Client Question: "How did we do last month?"
  • Agency Answer: "Great question! We spent $20,000 on Meta ads, which generated $80,000 in revenue for a 4.0x ROAS. Our cost per purchase was $25, and we saw a 15% increase in website traffic from our campaigns."
  • Common Tools: Google Analytics, Facebook Ads Manager, Shopify Analytics, and Madgicx. Madgicx’s One-Click Report and Business Dashboard centralizes performance data from Meta, Google, TikTok, Shopify, GA4, and other key platforms into a single real-time view, giving agencies instant visibility into core metrics like ROAS, MER, CPA, revenue, and spend. One-Click Report turns this live data into client-ready reports in seconds using customizable templates, eliminating manual exports and repetitive setup work. Reports update automatically with the latest performance data, ensuring agencies always present accurate, accurate, and up-to-date results while saving significant time on reporting workflows.

Try Madgicx’s reporting dashboards for free.

2. Diagnostic Analytics: "Why Did It Happen?"

This is where the real detective work begins. If descriptive analytics tells you the patient has a fever, diagnostic analytics figures out why. You're digging deeper to understand the root cause of a performance change.

  • Client Question: "Our sales dropped by 20% last week. What's going on?"
  • Agency Answer: "I looked into it. Our top-performing ad set saw a 50% spike in ad frequency and a 30% drop in CTR. It looks like the audience is experiencing creative fatigue. I've already paused that ad and launched a new creative to the same audience to get us back on track."
  • Common Tools: This often involves comparing data sets, filtering reports in Ads Manager, or using tools with drill-down capabilities.

3. Predictive Analytics: "What Is Likely to Happen?"

Now we're getting fancy. Predictive analytics uses historical data, statistical algorithms, and machine learning to forecast future outcomes. This is where you shift from being reactive to proactive, and it's incredibly valuable for your clients.

  • Client Question: "We want our biggest Black Friday ever. What kind of return can we expect if we double our ad spend?"
  • Agency Answer: "Based on last year's Q4 performance, our model suggests that doubling your spend could generate a 5.5x ROAS, with an estimated revenue of $250,000 during Cyber Week. To hit this, we need to start warming up our cold audiences now."
  • Common Tools: Custom Python/R models, advanced features in enterprise platforms, and AI-driven tools like Madgicx.

4. Prescriptive Analytics: "What Should We Do About It?"

This is the final frontier. Prescriptive analytics not only predicts what will happen but also recommends specific actions to achieve a desired outcome. It's like having a seasoned performance marketer providing data-backed suggestions 24/7.

  • Client Situation: Data shows that a client's overall ROAS is slowly declining week-over-week.
  • Agency Action (Powered by Prescriptive AI): A tool flags that the ROAS from a top-of-funnel lookalike audience has dropped below your target KPI. The system then recommends reallocating 30% of that ad set's budget to a high-performing, middle-of-funnel interest-based audience.
  • Common Tools: This is the domain of sophisticated AI and machine learning platforms like Madgicx’s AI Marketer, which provides daily, one-click recommendations to optimize Meta campaigns.

How Analytics Data Works: An Agency's 5-Step Workflow

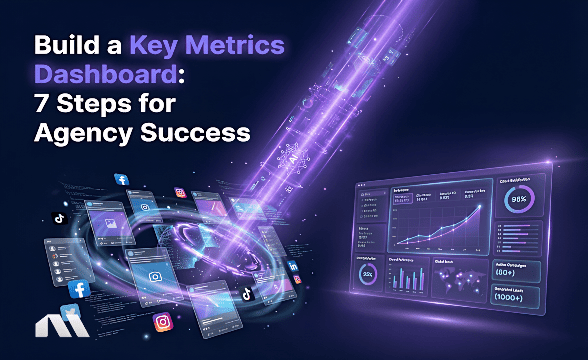
To avoid the "chaotic spreadsheet" problem for good, you need a system. A repeatable workflow is the key to scaling your agency's analytics capabilities without scaling your team's workload. Here's a simple 5-step process you can adapt for every client.

  1. Collection: This is where data is gathered from various sources—Meta Ads, Google Ads, Shopify, GA4, Klaviyo, etc. This is often an agency's biggest bottleneck.
  2. Storage: The collected data needs a home. This could be a simple Google Sheet for a small client or a sophisticated data warehouse like Google BigQuery for enterprise-level needs.
  3. Processing: Raw data is often messy. This step involves organizing it into a usable format, like making sure date formats from different exports match up.
  4. Cleaning: Here, you scrub the data for errors, duplicates, or inaccuracies. Did a tracking glitch cause a massive, one-day spike in reported conversions? You'd identify and correct that here to avoid making bad decisions.
  5. Analysis: This is the fun part! It's where you apply the four types of analytics (descriptive, diagnostic, predictive, prescriptive) to extract those juicy insights that will make your client love you.
Pro Tip: Manually exporting CSVs from five different platforms for ten different clients is a recipe for burnout. A unified platform that automatically pulls this data into one place is essential for scaling. Trust us on this one.

E-commerce Workflow Example: For a new Shopify client, your workflow might look like this:

  1. Collection: Connect their Shopify, Meta Ads, and Google Ads accounts to a central dashboard like Madgicx.
  2. Processing & Cleaning: The platform automatically standardizes and cleans the data for you.
  3. Analysis: You immediately run a diagnostic analysis on their historical ad account and find their top-selling product has never been used in a top-of-funnel campaign. Boom—you have your first "quick win" strategy for your kickoff call.

The Modern Agency's Analytics Tool Stack

You don't need to be a data scientist to run a data-driven agency, but you do need the right tools. Your stack can range from free and simple to powerful and complex.

  1. Spreadsheets (Google Sheets, Excel): The OG. Great for basic analysis and small clients, but they break down quickly as complexity and data volume grow.
  2. Data Visualization (Tableau, Looker Studio): These tools create beautiful, interactive dashboards but often require a dedicated person to set up and maintain data connections.
  3. Cloud & Programming (AWS, SQL, Python): This is the enterprise-level stack. It offers infinite flexibility but requires specialized skills (and salaries) to manage.
  4. All-in-One Advertising Platforms (Madgicx): These platforms are built for advertisers and agencies. They combine data collection, processing, visualization, and AI-powered analysis in one subscription.
Pro Tip: Your junior account managers don't need to learn SQL. Modern tools with AI interfaces can empower your entire team to get deep insights. For example, with Madgicx's AI Chat, a junior AM can simply ask, "Which of Client X's campaigns had the best ROAS last week?" and get a quick, data-backed answer. It's a game-changer for training and efficiency.

Where to Apply Analytics: Use Cases for E-commerce Clients

Theory is great, but let's talk about putting this to work. For your e-commerce clients, analytics should be woven into every stage of your relationship.

  1. Client Onboarding: Run a diagnostic analysis on a new client's historical ad account. Look for wasted budget or untapped potential. Presenting these "quick wins" in the first 30 days is the fastest way to build trust.
  2. Monthly Reporting: Use descriptive analytics to build automated performance dashboards. A tool like the One-Click Report can generate a comprehensive, client-ready report in seconds, saving your team hours of manual work.
  3. Quarterly Business Reviews (QBRs): This is where you really shine. Use predictive analytics to forecast results for the upcoming quarter. Propose new strategies backed by data, like shifting budget to higher-LTV channels.

Best Practices & Common Pitfalls for Agencies

As you build out your agency's analytics practice, keep these dos and don'ts in mind. We've learned these the hard way so you don't have to.

Best Practices:

  1. Standardize Your KPIs: Create a KPI template for all clients in a similar vertical. This allows for easier cross-client analysis and benchmarking.
  2. Focus on Business Goals, Not Vanity Metrics: A client cares about profit, not impressions. Always tie your analysis back to their bottom line.
  3. Start Small: Don't try to build a predictive LTV model on day one. Start by mastering descriptive and diagnostic analytics. The rest will follow.

Common Pitfalls:

  1. Data Silos: An agency's worst enemy. When your Meta, Google, and Shopify data live in different places, you can't see the full picture of the customer journey.
  2. Poor Data Quality: "Garbage in, garbage out." If your tracking is off, your analysis will be flawed. Investing in robust tracking (like server-side tracking) is non-negotiable.
  3. Analysis Paralysis: Having too much data can be as bad as having none. Use a simple framework: if a client asks "what," use descriptive. If they ask "why," use diagnostic.

FAQ

What's the difference between data analytics and client reporting?

Think of it this way: reporting shows what happened (descriptive). Analytics explains why it happened and what to do next (diagnostic, predictive, and prescriptive). A good agency provides reports. A great agency delivers analytics.

How can I prove the ROI of my agency's services using analytics?

Use before-and-after comparisons. Track a baseline of their key metrics (ROAS, CPA) for the 90 days before you took over. Then, showcase the improvement after your first 90 days of implementing data-driven optimizations. The numbers won't lie.

How long does it take to see results from analytics for a new client?

You can often find "quick wins" by running a diagnostic analysis on historical data in the very first week. For more advanced predictive work, you'll typically need at least 30-60 days of clean data to spot meaningful patterns.

Our junior staff struggle with analytics. How can we scale without hiring senior analysts?

This is the perfect use case for AI-powered tools. Platforms with natural language queries, like Madgicx's AI Chat, empower junior team members to access senior-level insights without ever having to build a pivot table. It's like giving everyone on your team an analyst co-pilot.

Turn Data Into Your Agency's Competitive Edge

So, there you have it. Analytics isn't some dark art reserved for data scientists. It's a practical, powerful toolset that can transform your agency from a simple service provider into an indispensable strategic partner.

Your next step is simple. This week, pick one client. Instead of just reporting their ROAS, find one "why" question to answer. Why did it go up? Why did it go down? Dig in, find the cause, and present the insight. That small shift is the first step toward building a data-driven agency that clients will never want to leave.

Start Madgicx’s free trial and see what smarter insights can do for your agency.

Think Your Ad Strategy Still Works in 2023?
Get the most comprehensive guide to building the exact workflow we use to drive kickass ROAS for our customers.
Scale Your Agency with Better Analytics Backed by AI

One-Click Reporting pulls live performance data from platforms like Meta, Google, TikTok, Shopify, and GA4 into customizable, client-ready report templates in seconds. Reports stay automatically updated, so agencies always share accurate, real-time results. AI Chat gives you instant, data-backed performance clarifications. Just ask and get a clear answer.

Start Your Free Trial with Madgicx
Date
Jan 20, 2026
Jan 20, 2026
Annette Nyembe

Digital copywriter with a passion for sculpting words that resonate in a digital age.

You scrolled so far. You want this. Trust us.