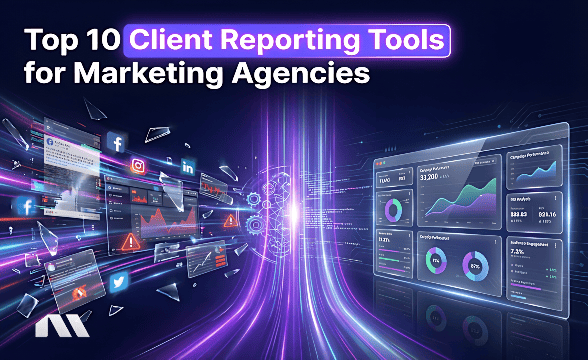
It’s 9 PM on a Sunday. You’re staring at a Frankenstein’s monster of a spreadsheet, trying to stitch together data from Facebook Ads Manager, Google Ads, and a client’s Shopify backend.
The weekly check-in is tomorrow morning, and you’re still trying to figure out why ROAS dropped 15% while TikTok spend doubled. Sound familiar? You’re not alone.
This chaotic, time-sucking ritual is the unofficial pastime of almost every agency owner we know. It’s no wonder that research shows only 23% of marketers are confident they're tracking the right KPIs . We get so lost in a sea of metrics that we forget what actually matters.
Understanding the right key performance indicators for marketing is crucial. The most important ones for any agency are Return on Ad Spend (ROAS), Customer Acquisition Cost (CAC), and Customer Lifetime Value (LTV). Why? Because these are the metrics that directly connect your hard work to a client's bottom line: revenue and profit.
This guide is your new agency playbook. We’re not just giving you a list; we’re giving you a framework to track the right metrics, prove your immense value, and build a reporting system that actually helps you retain clients and scale your agency—without the Sunday night spreadsheet scramble.
What You'll Learn
- How to categorize KPIs for agency growth vs. client performance.
- The top KPIs for measuring cross-channel client campaign success.
- Up-to-date industry benchmarks for Meta, Google Ads, and Email.
- Bonus: A framework for building a KPI dashboard that wows clients.
Why Most KPI Tracking Fails (And How to Fix It)
Let’s be honest: "data-driven" has become one of those buzzwords that sounds smart in a meeting but often leads to analysis paralysis. We’re drowning in data but starving for wisdom. The problem isn't a lack of metrics; it's a lack of a coherent story.
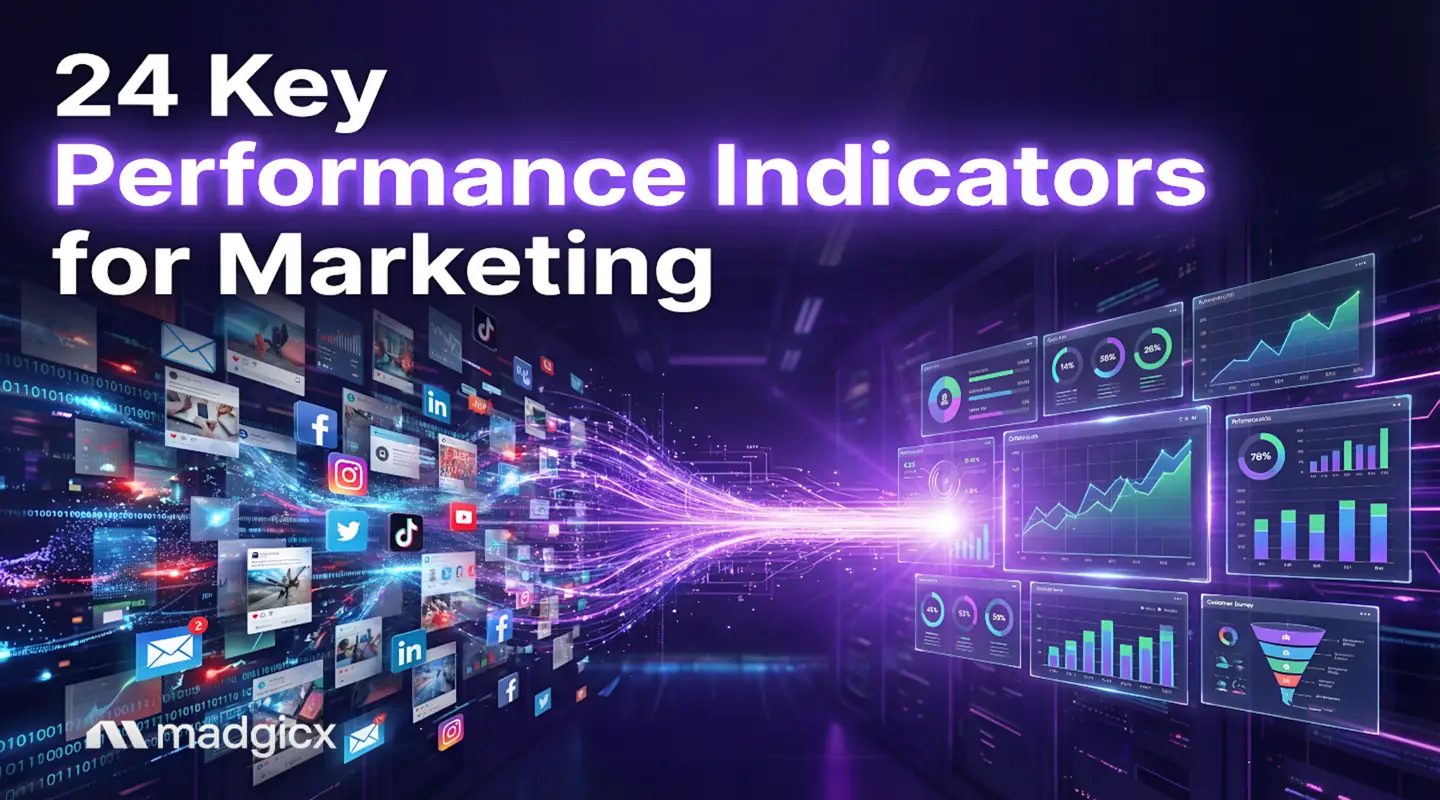
So, what are the key performance indicators for marketing? Key Performance Indicators for marketing (KPIs) are specific, measurable values used to track the effectiveness of campaigns against core business objectives. For agencies, this means tracking metrics that prove you're making your clients money.
The stakes are ridiculously high. According to recent industry analysis, a staggering $100 billion in media spend is wasted annually due to poor measurement . That’s a lot of client budget going down the drain because agencies are tracking vanity metrics instead of what drives real business results.
The fix? Stop thinking about KPIs as one giant, terrifying list. Instead, organize them into a framework that tells a clear story about your agency's health and your clients' success.
We break it down into three simple categories:
- Agency Growth & Client Acquisition: Metrics that measure the health of your business.
- Client Performance: The tactical, in-the-weeds metrics that show your campaigns are working.
- Client Strategy & ROI: The big-picture metrics that get you contract renewals.
This framework turns your reporting from a defensive chore into a proactive tool for growth.
Category 1: Agency Growth & Client Acquisition KPIs
Before you can get amazing results for your clients, you have to get clients in the door. This first batch of KPIs is all about measuring the health and profitability of your own agency. Think of this as your agency’s financial dashboard.
1. Lead Velocity Rate (LVR)
- What it is: The month-over-month growth rate of your qualified leads. It’s not about the number of leads, but the momentum of your lead generation.
- Why it matters: LVR is a leading indicator of future revenue . If your LVR is consistently high, you can confidently predict sales growth. If it stalls, you know you have a top-of-funnel problem to solve before it hits your bank account.
- Formula: ((Number of Qualified Leads This Month - Number of Qualified Leads Last Month) / Number of Qualified Leads Last Month) x 100
2. Cost Per Lead (CPL)
- What it is: The average cost to generate one new lead for your agency.
- Why it matters: This tells you how efficient your own marketing efforts are. If this number starts creeping up while your lead quality stays the same, it's an early warning that your own marketing funnel needs a tune-up.
- Formula: Total Ad Spend / Total New Leads
3. Client Acquisition Cost (CAC)
- What it is: The total cost to acquire one new paying client. This goes beyond ad spend to include sales salaries, marketing team overhead, and software costs.
- Why it matters: This is the "true cost" of growth . If it costs you $5,000 to land a client who pays you a $2,000/month retainer, you know it takes 2.5 months to break even.
- Formula: (Total Sales & Marketing Costs) / Number of New Clients Acquired
4. Client Lifetime Value (LTV)
- What it is: The total net profit your agency can expect to make from an average client over their entire relationship with you.
- Why it matters: LTV tells you what a client is really worth. It helps you decide how much you can afford to spend to acquire them (your CAC) and which types of clients are the most valuable in the long run. This isn't just their retainer; you have to subtract your costs to service them, including your team's time and software fees.
- Formula: (Average Monthly Retainer x Average Client Lifespan in Months) - Costs to Service Client
5. LTV:CAC Ratio
- What it is: The golden ratio. It compares the lifetime value of a client to the cost of acquiring them.
- Why it matters: This is arguably the single most important metric for your agency's long-term health. A healthy ratio (typically 3:1 or higher) means you have a sustainable, profitable business model. A 1:1 ratio means you’re spending as much to get a client as they’re worth—a recipe for disaster.
- Formula: LTV / CAC
Category 2: Client Performance KPIs (By Channel)
Alright, this is where the rubber meets the road. These are the tactical, channel-specific KPIs you live and breathe every day. They tell you what’s working, what’s not, and where to optimize to improve client results.
A. Meta Ads (Facebook & Instagram) KPIs
Meta is the bread and butter for most e-commerce and lead-gen agencies. Mastering these KPIs is non-negotiable.
6. Return on Ad Spend (ROAS)
- What it is: The amount of revenue generated for every dollar spent on advertising. It’s the king of performance metrics
- Formula: Total Revenue from Ads / Total Ad Spend
7. Cost Per Purchase (CPP) / Cost Per Acquisition (CPA)
- What it is: The average cost to acquire one customer or desired action (like a lead or a sale).
- Formula: Total Ad Spend / Total Purchases or Acquisitions
8. Click-Through Rate (CTR)
- What it is: The percentage of people who saw your ad and clicked on it.
- Why it matters: CTR is a primary indicator of creative and audience relevance . A low CTR often means your ad isn't resonating, or your creative is just plain boring.
9. Frequency
- What it is: The average number of times a person has seen your ad.
- Why it matters: This is your audience saturation alarm . If frequency gets too high (say, above 5-7 in a week for a prospecting audience), you're likely annoying people and performance will suffer.
10. Conversion Rate (CVR)
- What it is: The percentage of people who clicked your ad and then completed a desired action on your website (e.g., made a purchase).
- Why it matters: This metric connects ad performance to your website's effectiveness. A high CTR but low CVR means the problem is likely on the landing page , not the ad.
Benchmark Table 1: Typical Meta Ads KPIs (E-commerce)
| Metric |
Below Average |
Average |
Good |
Excellent |
| ROAS |
< 2.0x |
2.0x – 4.0x |
4.0x – 6.0x |
6.0x+ |
| CPP |
> $50 |
$25 – $50 |
$15 – $25 |
< $15 |
| CTR (Link) |
< 0.9% |
0.9% – 1.5% |
1.5% – 2.5% |
2.5%+ |
| CVR |
< 1.5% |
1.5% – 3.0% |
3.0% – 5.0% |
5.0%+ |
Note: Benchmarks are estimates based on aggregated industry data and can vary widely by industry, price point, and brand recognition.
How to Improve Your Meta Ads KPIs
- Improve ROAS: Use Madgicx's AI Marketer to get AI-powered recommendations that help you scale winning ad sets and pause those wasting budget. It provides 24/7 monitoring to help protect your ROAS.
- Lower CPP: Refine your audiences. Go beyond basic interests and build high-intent lookalike audiences from your client's best customer lists.
- Increase CTR: Test, test, and test more creative. Use Madgicx's AI Ad Generator to create dozens of high-quality image ad variations in seconds, helping you find a winner without waiting on a design team.
B. Google Ads KPIs
For clients with high-intent customers, Google Ads is a goldmine. But it's a different beast with its own set of critical metrics.
11. Conversion Rate (CVR)
- What it is: Same as on Meta, but here it’s even more critical. It measures the percentage of clicks that result in a conversion.
- Why it matters: On a high-intent platform like Search, a low CVR is a major red flag that your landing page experience is failing to meet user expectations.
12. Cost Per Click (CPC)
- What it is: The amount you pay for each click on your ad.
- Formula: Total Cost / Total Clicks
13. Quality Score
- What it is: A 1-10 score from Google that estimates the quality of your ads, keywords, and landing pages.
- Why it matters: A higher Quality Score leads to lower CPCs and better ad positions . It's Google's way of rewarding you for being relevant.
14. Click-Through Rate (CTR)
- What it is: The percentage of impressions that resulted in a click.
- Why it matters: In Google Search, CTR is a direct measure of how well your ad copy matches the user's search query .
15. Impression Share (IS)
- What it is: The percentage of impressions your ads received compared to the total number they were eligible to get.
- Why it matters: A low Impression Share means your competitors are outbidding you or have a better Quality Score. It tells you how much room there is to grow.
Benchmark Table 2: Typical Google Ads KPIs (Search)
| Metric |
Below Average |
Average |
Good |
Excellent |
| CVR |
< 2.5% |
2.5% – 5.0% |
5.0% – 8.0% |
8.0%+ |
| CTR |
< 3.0% |
3.0% – 6.5% |
6.5% – 10% |
10%+ |
| Quality Score |
< 5/10 |
5/10 – 7/10 |
8/10 |
9/10+ |
Sources: Based on industry averages from sources like WordStream.
How to Improve Your Google Ads KPIs
- Improve CVR: Ensure your landing page is hyper-relevant to the ad group . If the ad is for "red running shoes," the landing page should show red running shoes, not the entire shoe category.
- Improve Quality Score: Create tightly-themed ad groups . Don't lump hundreds of keywords into one ad group. Focus on a small, related set of keywords and write ad copy that speaks directly to them.
- Increase CTR: Use ad extensions (sitelinks, callouts, structured snippets) to make your ad take up more real estate and provide more information.
C. Email Marketing KPIs (for E-commerce Clients)
For e-commerce clients, email isn't just a retention tool; it's a revenue-driving powerhouse. Tracking its performance is crucial.
16. Open Rate
- What it is: The percentage of recipients who opened your email.
- Why it matters: It’s the first hurdle. A low open rate means your subject line failed or your list health is poor.
17. Click-Through Rate (CTR)
- What it is: The percentage of people who opened the email and clicked on a link inside.
- Why it matters: This measures the engagement and effectiveness of your email's content and call-to-action.
18. Conversion Rate (CVR)
- What it is: The percentage of email recipients who clicked on a link and completed a desired action (usually a purchase).
- Why it matters: This directly ties your email efforts to revenue .
19. Unsubscribe Rate
- What it is: The percentage of recipients who opted out of your email list after receiving a campaign.
- Why it matters: A high unsubscribe rate is a clear sign your content isn't relevant or you're sending too frequently.
20. List Growth Rate
- What it is: The rate at which your email list is growing.
- Why it matters: A healthy list is a growing list. If your list is stagnant or shrinking, your email channel's long-term potential is capped.
Benchmark Table 3: Typical Email Marketing KPIs (E-commerce)
| Metric |
Below Average |
Average |
Good |
Excellent |
| Open Rate |
< 25% |
25% – 42% |
42% – 55% |
55%+ |
| CTR |
< 1.5% |
1.5% – 3.0% |
3.0% – 5.0% |
5.0%+ |
| CVR |
< 1.0% |
1.0% – 2.5% |
2.5% – 4.0% |
4.0%+ |
| Unsubscribe Rate |
> 0.5% |
0.3% – 0.5% |
0.1% – 0.3% |
< 0.1% |
Sources: Benchmarks are based on industry data from platforms like HubSpot, Klaviyo, and Mailchimp.
How to Improve Your Email KPIs
- Improve Open Rates: Spend 80% of your time on the subject line. Use personalization, curiosity, and urgency. A/B test everything.
- Improve CTR: Use a single, clear call-to-action (CTA) . Don't give readers five different things to click on. Make the button big, bold, and benefit-driven.
- Improve CVR: Segment your lists! Send targeted offers to specific groups (e.g., VIP customers, cart abandoners). A generic blast to everyone is a recipe for low conversions.
Category 3: Client Strategy & ROI KPIs
Okay, you’ve proven your campaigns are working tactically. Now it’s time to zoom out and show the client the big picture. These are the strategic KPIs that demonstrate the overall business impact of your work and get you contract renewals.
21. Blended ROAS / Marketing Efficiency Ratio (MER)
- What it is: The holy grail of holistic measurement. It’s your client's total store revenue divided by their total ad spend across all platforms.
- Why it matters: In a post-iOS14 world where attribution is a mess, Blended ROAS gives you the true north. It answers the simple question: "For all the money we're putting into ads, how much are we getting back in total?" It gives clients confidence that their overall investment is paying off .
- Formula: Total Revenue / Total Ad Spend (from all channels)
22. Customer Lifetime Value (LTV) - For Your Client
- What it is: The total profit a client's business makes from an average customer.
- Why it matters: Your job isn't just to get the first sale; it's to acquire profitable customers . If you're driving customers with a high LTV, you're building a sustainable business for your client .
23. Customer Retention Rate (CRR)
- What it is: The percentage of existing customers who remain customers over a specific period.
- Why it matters: Improving retention is the fastest way to boost profitability, especially for subscription or repeat-purchase businesses.
- Formula: ((Number of Customers at End of Period - Number of New Customers Acquired) / Number of Customers at Start of Period) x 100
24. New vs. Returning Customer Revenue
- What it is: A simple breakdown of revenue from first-time buyers versus repeat purchasers.
- Why it matters: This ratio tells a story about business health. A healthy brand has a strong balance. If 95% of revenue is from new customers, you have a leaky bucket —customers aren't sticking around.
How to Build a KPI Dashboard That Wows Clients
Your clients are busy. They don't have time to decipher a 30-tab spreadsheet. Your job is to deliver insights, not just data. A well-built dashboard is your secret weapon for agency reporting that wows.
Here’s a simple four-step framework:
- Define the "One Metric That Matters" (OMTM): Ask your client, "If you could only look at one number every day to know if your business is healthy, what would it be?" For e-commerce, it might be Blended ROAS (MER). For lead-gen, it might be Cost Per Qualified Appointment. This OMTM becomes the headline of your dashboard.
- Consolidate Your Data Sources: This is where most agencies get stuck. You need to pull data from Meta, Google, TikTok, Shopify, and more. Doing this manually is a nightmare. A dedicated digital marketing dashboard connects to all your sources and pulls the data automatically.
- Visualize the Data for Clarity: Don't just show tables of numbers. Use visuals to tell a story.
- Line graphs for trends over time (e.g., ROAS over the last 30 days).
- Pie charts for composition (e.g., New vs. Returning Customer Revenue).
- Scorecards for your OMTM and other key top-line metrics.
- Automate the Reporting: The final step is to automate the entire process. This is where automated reporting for agencies becomes a game-changer. A great dashboard should be a live link the client can check anytime, not a static PDF you create every week.
This is exactly why we built the One-Click Report into Madgicx. Connect all your client's accounts and generate a comprehensive, shareable marketing agency dashboard in about 60 seconds.
The Best Tools for Tracking Marketing KPIs
Okay, you've got the framework and the strategy. Now, let's talk about the toolkit. The right software can be the difference between spending your weekend building reports and, well, actually having a weekend. Here are our top picks for tracking the KPIs that matter.
Madgicx: Best for Multi-Channel Reporting & Ad Optimization
- What it is: Madgicx is an all-in-one advertising suite designed specifically for performance marketers and agencies.
- Why it's a Top Choice for Agencies: Madgicx combines automated reporting, real-time performance monitoring, AI-powered diagnostics, and optimization tools in one platform.
- It starts with One-Click Report, which lets agencies generate customizable, client-ready reports from pre-built templates in seconds. These reports pull data from Meta, Google, TikTok, Shopify, GA4, and Klaviyo into a single, shareable view—eliminating manual exports and spreadsheet formatting.
- Next, the Business Dashboard gives teams and leadership a real-time, blended overview of account performance. Agencies can monitor spend, revenue, ROAS, MER, CAC, and profitability across all clients in one place, helping them spot risks, opportunities, and performance shifts faster.
- AI Chat then adds diagnostic depth. Instead of digging through dashboards, teams can ask questions like “Why did CPA increase yesterday?” or “Which campaigns are underperforming?” and get instant explanations based on live account data.
- Finally, AI Marketer turns insights into action. It continuously analyzes performance and serves you optimization recommendations—such as scaling winners, pausing inefficient ads, or adjusting budgets—so agencies aren’t just told what’s wrong, but how to fix it.
- Pricing: Starts at $45/mo, with a 7-day free trial.
HubSpot: Best for Inbound Marketing & CRM-Centric KPIs
- What it is: HubSpot is a leader in inbound marketing. It’s a full CRM platform that includes marketing, sales, and service hubs.
- Why it's great: If your agency focuses heavily on content marketing, SEO, and lead nurturing, HubSpot is fantastic. It excels at tracking the full customer journey , from first blog view to closed deal, giving you deep insights into LTV.
- Pricing: Marketing Hub plans range from $800-$3,600/month .
Triple Whale: Best for E-commerce Attribution & Analytics
- What it is: Triple Whale is a popular dashboard software for e-commerce brands, known for its clean interface and focus on attribution.
- Why it's great: It provides a clear view of Blended ROAS (MER) and helps brands understand marketing impact with its server-side pixel. It’s a great tool for e-commerce-focused agencies that need a simple, powerful financial summary for clients.
- Pricing: Offers a free tier with custom pricing for larger plans .
Google Analytics 4 (GA4): The Essential Free Tool
- What it is: The free, industry-standard tool for tracking website traffic and user behavior.
- Why you need it: No matter what other tools you use, you need GA4. It's your source of truth for on-site behavior , tracking KPIs like bounce rate, time on page, and user flow. It provides the "why" behind the performance you see in your ad platforms.
Frequently Asked Questions (FAQ)
1. How do I prove marketing ROI to a client who doesn't get it?
Focus on the metrics they understand: money in and money out. Start with Blended ROAS (MER). Say, "For every $1 we spent on ads, we generated $X in total revenue for you." Then, connect your work to high-level business goals by showing improvements in Client LTV and the LTV:CAC ratio.
2. Which 3-5 KPIs should I put on a weekly client summary report?
Keep it simple and impactful. We recommend:
- Total Ad Spend (all channels)
- Total Revenue
- Blended ROAS (MER)
- Customer Acquisition Cost (CAC)
- Number of New Customers
This gives them a 30,000-foot view of performance without overwhelming them.
3. What's a good ROAS for Facebook ads today?
It depends heavily on industry and profit margins, but a general rule of thumb is:
- Below 2x: Likely losing money or breaking even.
- 2x - 4x: Profitable and healthy for most businesses.
- Above 4x: You're doing great and have room to scale aggressively.
4. How can I track KPIs across Meta, Google, and TikTok without spending all day in spreadsheets?
This is the million-dollar question for agencies. A highly effective solution is to use a centralized reporting tool. A platform like Madgicx connects to all your ad accounts and automatically pulls the data into one unified dashboard, saving you hours of manual work every week.
Conclusion: Turn Data into Decisions
Tracking KPIs is not the goal. Making better, faster, more profitable decisions is the goal. By organizing your metrics into the three core categories— Agency Growth, Client Performance, and Client ROI —you transform your reporting from a backward-looking chore into a forward-looking strategy session. You stop defending your retainer and start demonstrating your indispensable value. You stop drowning in data and start surfing the waves of insight.
Here’s your next step: pick one client. Audit their current report against this framework. Identify the one key metric—whether it’s CTR on their top ad or their Blended ROAS—that you can focus on and improve over the next seven days.
And when you're ready to automate this entire process and get back to doing what you love—growing brands—we'll be here. Try Madgicx free today.


.avif)