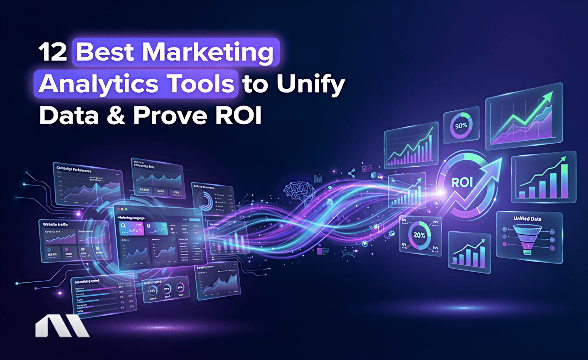
It's the end of the month. You've got 15 client reports to build, and you're drowning in spreadsheets.
You're staring at a sea of numbers, trying to piece together a story that explains a dip in ROAS for one client while justifying the ad spend for another. Sound familiar? This manual grind isn't just tedious; it's a productivity killer, pulling your best minds away from high-level strategy and into the weeds of copy-pasting data.
The solution is simpler than you think: a powerful set of reporting tools for data analysis. At their core, these tools are your agency's secret weapon—software solutions that automate the collection, analysis, and visualization of business data, letting you create killer client dashboards and performance reports in a fraction of the time.
Imagine this instead: What if you could automate this whole mess and get quick, clear-as-day answers to your clients' toughest questions without breaking a sweat?
This guide is your way out of spreadsheet hell. We're breaking down 10 powerful reporting tools built for marketing agencies, helping you choose the right one to save time, scale your operations, and—most importantly—wow your clients.
What You'll Learn
Here's a quick look at what we're covering to get you out of spreadsheet jail and back to strategy:
- A leading reporting and optimization platform for agencies managing Meta ads
- 9 other powerful reporting tools for different budgets and use cases
- How to choose the right tool based on your agency's size, budget, and technical skill
- Key features every agency reporting tool should have
- Bonus: How to leverage automation to save significant time each week on reporting
What Are Reporting Tools for Data Analysis?
At their core, reporting tools for data analysis are software solutions that automate the collection, analysis, and visualization of business data. They connect to sources like Facebook Ads and Google Ads, pulling all your metrics into a single platform to create clear, interactive dashboards and reports, eliminating the need for manual data entry and spreadsheet management.
Think of it as a three-step process:
- Data Integration: The tool automatically pulls data from all the platforms you use. No more manual CSV downloads.
- Data Processing: It crunches the numbers, calculates your key metrics, and helps find trends you might have missed.
- Data Visualization: It turns that raw data into beautiful, interactive dashboards and reports that actually tell a story.
While it feels like magic, it's becoming the industry standard. A 2024 study from G2 found that 67% of the global workforce now has access to Business Intelligence (BI) tools.
Yet, the overall adoption rate is still only around 20%. This means there's a huge competitive advantage for agencies that get on board now.
The Business Case: Why Your Agency Needs a Reporting Tool
Still on the fence? We get it. It's another tool, another subscription. But let's talk numbers, because investing in the right tool isn't a cost—it's a strategic move that pays for itself over and over.
Save Thousands of Hours
Manual reporting is a time vampire. Think about the hours your team spends every week just pulling data. Now imagine that time is spent on creative strategy or client communication. That's what automation does.
For example, Chipotle saved thousands of employee hours by automating its financial reporting. In the agency world, European Wax Center used the reporting tool Domo to achieve a 90% reduction in reporting time across its 900+ locations. That's not just a small efficiency gain; it's a complete transformation of their workflow.
Support Stronger ROI
Here's a stat that should make every agency owner sit up straight: companies see an average return of 544% on their investment in marketing automation.
And it doesn't take years to see results. The same research shows that 76% of companies see a return on their investment within the first year. By getting clearer insights faster, you can optimize campaigns more effectively, reduce wasted ad spend, and directly improve your clients' bottom line—and your own.
Make Smarter, Faster Decisions
The market moves fast. A campaign that was performing well on Monday can dip by Wednesday. With real-time analytics, you're not looking at stale data from last week. You're seeing what's happening right now, allowing you to pivot, scale, or pause campaigns with confidence. This is a core principle of effective AI for marketing.
Scale Without Scaling Your Team
Want to take on more clients without hiring more account managers? A reporting tool is your force multiplier. By automating the most time-consuming tasks, you empower a small, lean team to manage a larger portfolio of clients without sacrificing quality.
Improve Client Retention
Happy clients are clients who understand the value you're providing. Automated, professional reports build trust and transparency. Instead of sending a messy spreadsheet, you can share a live, interactive dashboard that clearly shows the progress you're making toward their goals. It turns reporting from a chore into a powerful client retention tool.
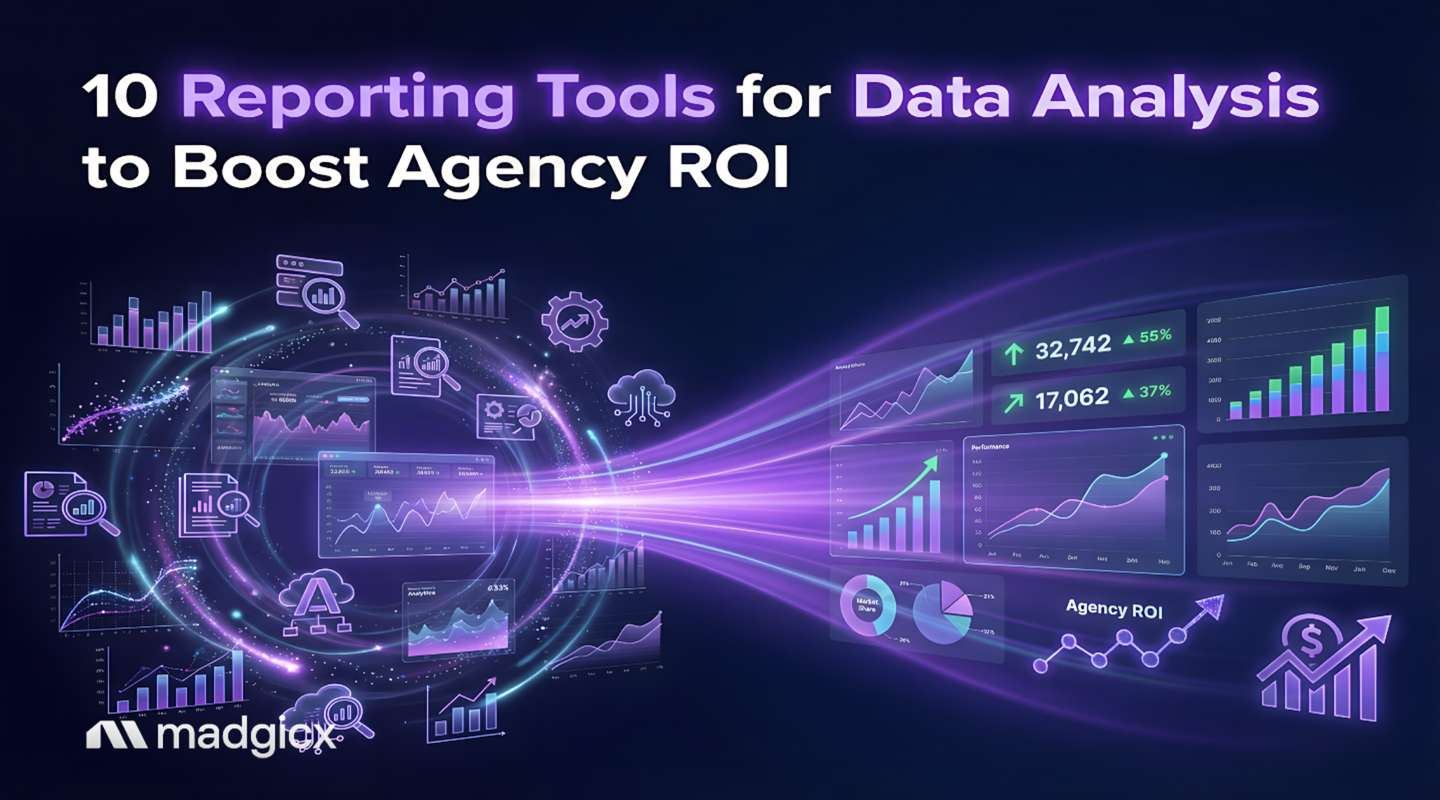
The Top 10 Reporting Tools for Marketing Agencies
Alright, let's get to the good stuff. We've analyzed the market and separated the contenders from the pretenders. Here are 10 powerful tools, starting with a solution for agencies that are serious about scaling on Meta.
1. Madgicx (Best for Marketing Agencies)
Madgicx is more than a basic reporting tool — it’s a performance marketing platform built to simplify how agencies report on results. With One-Click Reporting and business-focused dashboards, teams can turn complex campaign data into clear, client-ready reports in minutes.
Instead of pulling numbers from multiple platforms, Madgicx brings your Meta, Google, TikTok, GA4, Shopify, and Klaviyo data into a single view. Reports are generated from pre-built, customizable templates and shared through secure links that stay up to date automatically.
Key Features:
- One-Click Reporting: Instantly create professional, cross-channel reports using live performance data.
- Business Dashboard: Present ad spend, revenue, and key KPIs in a finance-friendly format for stakeholders.
- Shareable Report Links: Give clients real-time access to their reports through a secure, always-updated link.
- Bonus AI Chat: This is a game-changer for agencies. Instead of digging through Ads Manager or reports, you can just ask, "Why did ROAS drop for Client X last week?" and get a quick, data-backed answer and actionable recommendations.
Best for: Marketing agencies and performance teams that need fast, accurate dashboard reporting with clear business-level insights — especially for Meta-led and e-commerce campaigns.
Pricing: Starts at $45/mo. Try Madgicx for free today.
2. Microsoft Power BI
- Description: A leading BI tool from Microsoft. If your agency or your clients are already living in the Microsoft 365 ecosystem (Excel, Teams, etc.), this is a natural and powerful fit.
- Key Features: Deep integration with Excel, powerful data modeling capabilities, interactive visualizations, AI-driven insights, and robust data governance.
- Best for: Mid-sized to large businesses, especially those already using Microsoft products.
- Use Case: Metro Bank used Power BI to build over 100 automated financial reports, saving significant manual effort and providing real-time insights to stakeholders.
- Pricing: Offers a free desktop version, with the Pro plan starting at $14/user/month.
3. Tableau
- Description: Tableau is a well-known name in data visualization. It's recognized for creating detailed, highly interactive dashboards that let you explore data in granular ways.
- Key Features: Drag-and-drop interface, extensive library of data connectors, advanced mapping capabilities, and a strong user community for support.
- Best for: Large enterprises and data-heavy organizations that need advanced, custom visualizations.
- Use Case: A large agency creates a custom, interactive dashboard for an enterprise client, allowing them to drill down into regional sales data and cross-reference it with marketing campaign performance.
- Pricing: Offers multiple tiers, with the Creator plan starting at $75/user/month.
4. Zoho Analytics
- Description: An affordable, user-friendly, and surprisingly powerful BI tool that's a popular choice for small and medium-sized businesses. It has strong AI capabilities that make data analysis more accessible.
- Key Features: AI-powered assistant ("Zia") for asking questions in natural language, 500+ business app integrations, white-label options for agencies, and predictive analytics.
- Best for: Small to medium-sized agencies and businesses looking for a balance of power and affordability.
- Use Case: A small e-commerce agency uses Zoho's AI assistant to quickly build reports on customer lifetime value for their Shopify advertising clients without needing a dedicated data analyst.
- Pricing: A free tier is available, with paid plans starting at $30/month (Basic).
5. Looker Studio (formerly Google Data Studio)
- Description: Google's free and incredibly easy-to-use reporting tool. It's the go-to choice for visualizing data from the Google ecosystem (Google Ads, Analytics, BigQuery, YouTube).
- Key Features: Seamless integration with Google products, fully customizable dashboards, easy report sharing, and a huge library of community-built connectors.
- Best for: Small teams, freelancers, and agencies heavily invested in the Google advertising and analytics ecosystem.
- Use Case: A freelance marketer quickly builds a live dashboard for a client tracking Google Ads, GA4, and YouTube performance, giving the client a single link to see all their key metrics in one place.
- Pricing: Free.
Enterprise Tools (Contact for Pricing)
These powerful platforms are geared toward larger organizations and typically require a custom quote based on your agency's specific needs.
6. Domo
- Description: An all-in-one, cloud-native platform that's built for speed and scale. It boasts over 1,000 data connectors, making it one of the most versatile platforms for integrating data from across an entire organization.
- Key Features: 1,000+ pre-built data connectors, real-time dashboards, automated alerts, mobile app for on-the-go monitoring, collaborative workspace features, and embedded analytics capabilities.
- Best for: Multi-location businesses, franchises, and large agencies managing complex data across numerous platforms and locations.
- Use Case: European Wax Center used Domo to slash its reporting time by 90% across its 900+ locations, providing real-time insights to stakeholders and automating complex multi-location reporting.
- Pricing: Contact for a custom quote.
7. Looker (Google Cloud)
- Description: Not to be confused with the free Looker Studio, this is Looker's enterprise-grade analytics platform. It's designed for data-driven organizations that want to create a centralized, reliable "data dictionary" for the entire company to use.
- Key Features: LookML modeling layer for consistent metrics, embedded analytics, API for custom integrations, governed data access, real-time data exploration, and seamless integration with BigQuery and other Google Cloud services.
- Best for: Enterprise organizations with dedicated data teams that need a single source of truth for company-wide analytics and want to embed analytics into their own applications.
- Use Case: A large e-commerce agency creates a unified data model in Looker that ensures all team members and clients are looking at the same metrics, eliminating discrepancies between departments and building trust in data-driven decisions.
- Pricing: Contact Google Cloud for a custom quote.
8. Sisense
- Description: Sisense is known for its high-performance data processing and its strength in "embedded analytics"—the ability to embed interactive dashboards and analytics directly into your own agency's software or client portal.
- Key Features: In-chip technology for fast data processing, drag-and-drop dashboard builder, white-label embedding capabilities, AI-powered insights, complex data modeling, and ability to handle massive datasets.
- Best for: Agencies building their own proprietary software or client portals who want to embed analytics directly into their platform, and organizations needing to analyze very large, complex datasets.
- Use Case: A SaaS agency embeds Sisense dashboards directly into their client portal, allowing clients to see their performance metrics without ever leaving the agency's platform, creating a seamless branded experience.
- Pricing: Contact for a custom quote.
9. Qlik Sense
- Description: A self-service analytics tool that focuses on data discovery. Its unique "Associative Engine" lets users explore data in any direction, helping to uncover hidden relationships between different data points that other tools might miss.
- Key Features: Associative Engine for unrestricted data exploration, AI-powered insights and suggestions, responsive design for any device, collaborative analytics, augmented analytics with natural language processing, and governed self-service.
- Best for: Data-driven organizations that want to empower business users to explore and discover insights independently, and teams that need to uncover hidden patterns and relationships in complex datasets.
- Use Case: A performance marketing agency uses Qlik Sense to explore the relationship between creative elements, audience demographics, and conversion rates, uncovering unexpected correlations that lead to a 40% improvement in campaign performance.
- Pricing: Contact for a custom quote.
10. Datapine (RIB BI+)
- Description: An AI-powered BI tool that offers a good mix of self-service analytics for business users and advanced features for data analysts. It also provides strong white-label options, making it a solid choice for agencies wanting to brand their reports.
- Key Features: AI-powered predictive analytics, automated report generation, extensive white-labeling capabilities, drag-and-drop dashboard builder, SQL mode for advanced users, and interactive data visualizations.
- Best for: Mid-sized agencies that need a balance between ease-of-use and advanced analytics capabilities, and agencies that want to deliver fully branded reports and dashboards to clients.
- Use Case: A digital marketing agency uses Datapine's white-label features to create fully branded client dashboards that appear as part of their own proprietary platform, while leveraging AI-powered insights to predict campaign performance and recommend optimizations.
- Pricing: Contact for a custom quote.
10 Key Features Every Agency Reporting Tool Needs
When you're comparing options, it's easy to get lost in a sea of features. Here's a simple checklist of the non-negotiables your agency needs from an ad tech platform for data analytics.
- Data Integration: It must seamlessly connect to the platforms your clients use, especially Facebook Ads, Google Ads, TikTok, and Shopify.
- Automated Data Aggregation: The ability to automatically pull fresh data from all connected sources, eliminating manual downloads.
- Real-Time Analytics: Data that's hours or days old is a liability. You need a live pulse on campaign performance.
- Customizable Dashboards: Every client is different. You need the flexibility to create bespoke dashboards that focus on the KPIs that matter to them.
- Data Visualization: Goodbye, spreadsheets. Hello, beautiful charts and graphs that tell a clear story and make complex data easy to understand.
- Self-Service Analytics: Empower your account managers to answer their own questions without needing to pull a data analyst off a critical project.
- Collaboration Features: The ability to tag team members, leave comments, and collaborate around insights is crucial for a fast-moving team.
- Mobile Access: Inspiration (or disaster) can strike anywhere. You need to be able to check on client performance from your phone.
- Export Options: You'll always need the ability to export reports to common formats like PDF, Excel, or CSV for presentations or offline analysis.
- Role-Based Security: Give clients view-only access to their own dashboards without worrying about them seeing other clients' data.
How to Choose the Right Reporting Tool for Your Agency
Feeling a little overwhelmed by the options? Totally normal. Let's break it down with a simple decision framework to find the perfect fit for your agency.
Pro Tip: Start with your biggest pain point, not the fanciest features. If you're drowning in Meta ad analysis, a specialized tool like Madgicx is a better starting point than a complex, all-purpose BI platform that requires a data team to manage.
By Budget:
|
Budget
|
Description
|
Top Picks
|
|
Free – ~$100/mo
|
Perfect for freelancers, small agencies, or those just starting out.
|
Looker Studio, Zoho Analytics (offers free/low-cost tiers)
|
|
Mid-Tier ($100 – $1,000/mo)
|
For growing agencies that need more power and user seats.
|
Madgicx (from $45), Power BI, Tableau (pricing often scales per user)
|
|
Enterprise ($1,000+/mo)
|
For large agencies or those with complex, enterprise-level clients.
|
Domo, Looker (Google Cloud), Sisense
|
By Technical Skill:
|
Technical Skill
|
Description
|
Top Picks
|
Beginner
(Drag-and-Drop)
|
Designed for marketers, not data scientists. You can get up and running in minutes.
|
Looker Studio, Madgicx
|
Intermediate
(Some SQL helpful)
|
More powerful and customizable, but you'll get more out of them if you're comfortable with basic data concepts.
|
Power BI, Tableau
|
Advanced
(Requires Data Team)
|
These are heavy-duty platforms that typically require a dedicated data analyst or team to set up and manage.
|
Looker (Google Cloud), Sisense
|
By Primary Use Case:
|
Primary Use Case
|
Description
|
Top Pick(s)
|
|
Cross-Channel Performance Analysis & Ad Optimization
|
You need more than just reports; you need an action platform.
|
Madgicx
|
|
General Business Intelligence
|
You need to analyze data from all corners of the business, from finance to operations.
|
Power BI, Tableau
|
|
Embedded Analytics
|
You want to build analytics directly into your own agency portal or software.
|
Sisense
|
|
Google Ecosystem Reporting
|
Your world revolves around Google Ads, GA4, and YouTube.
|
Looker Studio
|
Frequently Asked Questions (FAQ)
Can these tools automatically create reports for my clients?
Yes, in a way. A key feature is automating the data gathering and report generation process. While some tools can schedule and email static reports, many modern platforms like Madgicx focus on providing a shareable live dashboard that is always up-to-date. This saves you from sending files back and forth and is a cornerstone of reporting automation.
How do reporting tools handle data from different platforms like Facebook and Google?
They use things called data connectors or APIs (Application Programming Interfaces) to securely pull information from various sources into one centralized dashboard. This gives you a unified view of performance without having to log in and out of a dozen different platforms.
Will I need a data analyst to use these tools?
Not necessarily. Tools like Madgicx and Looker Studio are specifically designed for marketers and agency account managers, with intuitive, user-friendly interfaces. More advanced platforms like Looker (Google Cloud) and Sisense are more powerful but may benefit from having a technical user on the team.
Can I white-label reports with my agency's branding?
Yes, many tools geared towards agencies, such as Datapine and Zoho Analytics, offer white-labeling features. This allows you to add your own logo and branding to reports for a more professional look. This feature may be part of a higher-priced tier, so be sure to check the details.
Pro Tip: When presenting to clients, use a white-labeled, live dashboard instead of a PDF. It feels more transparent, professional, and interactive, reinforcing the value your agency provides.
Conclusion: Stop Reporting, Start Analyzing
Look, manual reporting is a silent profit-killer for agencies. It eats up your most valuable resource—your team's time—and pulls them away from the strategic work that actually drives client results.
By adopting the right tool, you can automate data collection, uncover deeper insights, and free up your team to focus on what they do best. We've covered 10 powerful options and a framework to choose the best fit for your agency's budget, skills, and goals.
Your immediate next step is to identify the single biggest time-suck in your current reporting process. If that involves manually pulling and organizing ad data from multiple platforms, Madgicx’s One-Click Report can automate the entire process in minutes.
Ready to reclaim your time and scale your agency? Start your free trial with Madgicx


.avif)