Think Your Ad Strategy Still Works in 2023?
Get the most comprehensive guide to building the exact workflow we use to drive kickass ROAS for our customers.


Picture this: It's 2 AM, and you're hunched over your laptop, squinting at your Meta ads dashboard. Your fashion brand's campaign shows a 1.2% CTR, and you're wondering if that's actually decent or if you're basically setting money on fire while your competitors laugh all the way to the bank.
Sound familiar? Here's the brutal truth: without proper industry benchmarks, you're essentially flying blind in a $183.80 billion Meta advertising ecosystem. Every day you operate without benchmark context is another day of potentially missed opportunities and wasted ad spend.
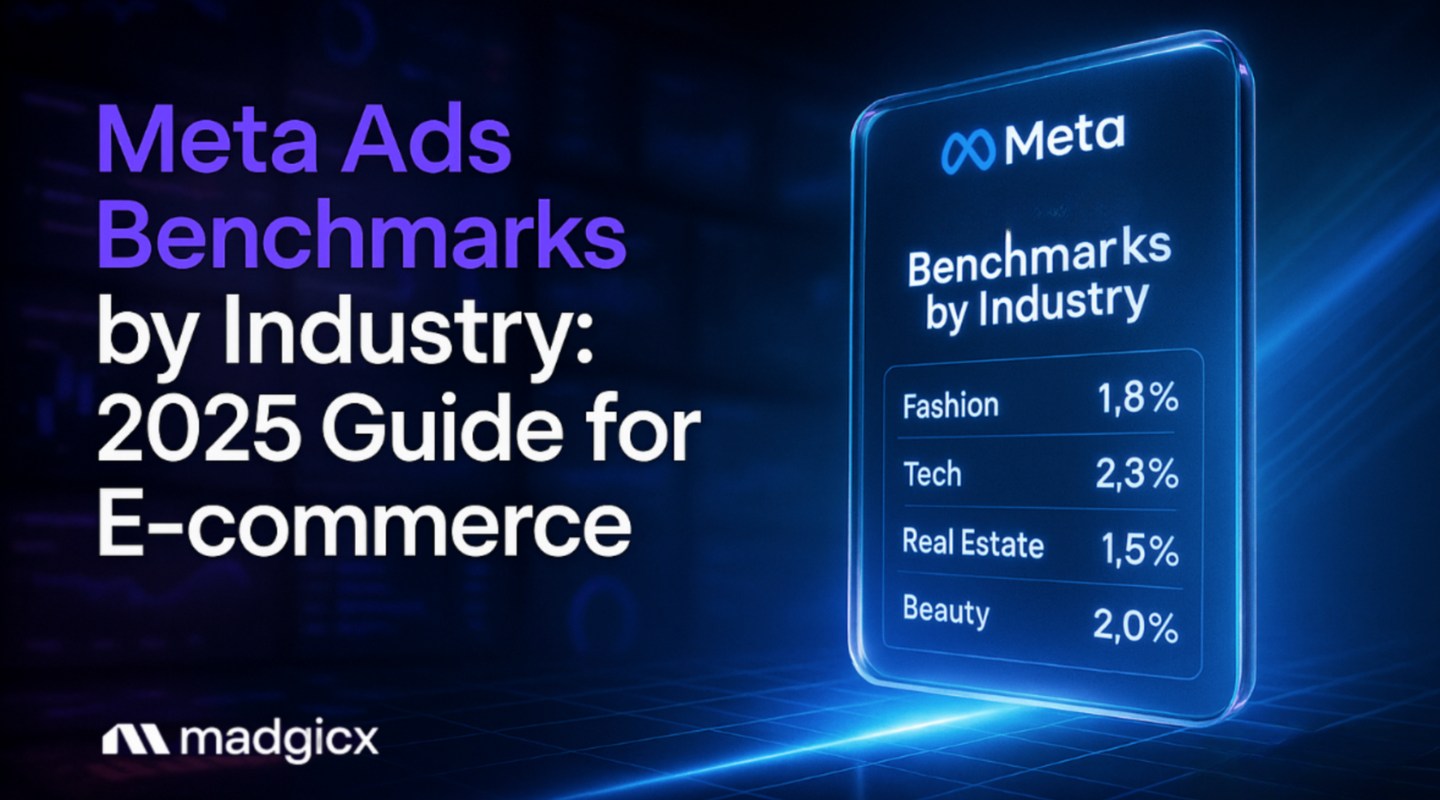
Meta ads benchmarking involves comparing your campaign performance against industry-specific standards across key metrics like CTR (1.80% median), CPC, and conversion rates to identify optimization opportunities and measure competitive performance. But here's what most benchmark guides won't tell you – generic, one-size-fits-all benchmarks can actually hurt your e-commerce performance if you don't understand the context behind those numbers.
We're diving deep into the benchmark data that actually matters for e-commerce success. You'll walk away with industry-specific Meta ads benchmarks for 15+ e-commerce sectors, understand why AI-powered optimization tools drive $4.52 return for every dollar spent, and learn why lead generation campaigns consistently outperform traffic campaigns with 2.53% vs 1.57% CTR respectively.
Plus, we'll share our step-by-step benchmark analysis framework that's helped thousands of e-commerce brands scale profitably. You'll also discover seasonal benchmark variations that can significantly improve your Q4 performance.
Let's get one thing straight – not all benchmarks are created equal. When someone throws around that 1.80% median CTR across all industries, it's about as useful as saying the average human has one testicle and one ovary. Technically true, practically useless.
For e-commerce businesses, meta ads benchmarking serves three critical purposes:
But here's where it gets tricky – your beauty brand shouldn't be comparing itself to B2B software companies, and your electronics store has completely different performance expectations than a fashion retailer.
The $183.80 billion Meta advertising landscape is incredibly diverse, with performance varying wildly based on industry, audience behavior, and seasonal trends. What matters is understanding where your specific e-commerce vertical stands and how to leverage that knowledge for profitable growth.
Pro Tip: Always focus on median values rather than averages when analyzing benchmarks. Averages get skewed by outlier campaigns (both spectacular successes and epic failures), while medians give you a more realistic picture of typical performance.
Now we're getting to the good stuff. Here's the comprehensive breakdown of how different e-commerce sectors actually perform on Meta, based on the latest 2025 data:
Fashion ads benefit from visual appeal, so their average CTR is above the platform median.
Electronics face moderate competition with longer consideration periods, resulting in reasonable costs, with the technology sector showing solid engagement rates.
Beauty brands benefit from strong visual content and demonstrate solid conversion rates, particularly in lead generation campaigns.
Home improvement shows strong conversion rates when users are ready to take action, with reasonable acquisition costs.
Health and fitness maintains steady performance with moderate costs, reflecting the motivated nature of health-conscious audiences.
For a deeper dive into how your competitors are performing in these sectors, check out our comprehensive guide on Facebook ads competitor analysis.
Here's where things get really interesting. The data shows that lead generation campaigns achieve 2.53% CTR compared to traffic campaigns at 1.57% – that's a 61% performance advantage. But why does this matter for meta ads benchmarking?
Lead generation campaigns excel because they're asking for a smaller commitment upfront. Instead of "Buy Now," you're saying "Get 20% Off Your First Order" or "Download Our Style Guide." This lower barrier to entry results in higher engagement and better data collection for retargeting.
The 8.78% conversion rate for lead campaigns significantly outperforms direct sales campaigns, making them perfect for building your email list and nurturing prospects through your sales funnel.
Traffic campaigns work best when you have a highly optimized website with strong conversion funnels already in place. They're ideal for retargeting warm audiences or promoting specific products to people who've already shown purchase intent.
The smartest e-commerce brands use a hybrid approach – lead generation campaigns for cold audiences to build their email list, followed by traffic campaigns to drive direct sales to warmed-up prospects. This strategy maximizes both engagement rates and lifetime customer value.
Pro Tip: Start new audiences with lead generation campaigns, then transition high-engagement users to traffic campaigns for direct sales. This approach typically improves overall funnel performance by 30-40%.
Manual meta ads benchmarking is like trying to watch every stock in the market simultaneously – theoretically possible, practically insane. This is where AI-powered optimization becomes a game-changer for e-commerce brands.
AI tools are driving $4.52 return for every dollar spent, and here's why: they can monitor your campaigns against industry benchmarks continuously, providing recommendations for adjusting bids, budgets, and targeting when performance drops below optimal levels.
AI systems continuously compare your campaign performance against real-time industry data, identifying when your CTR drops below the 1.80% median or when your CPC spikes above industry norms. Instead of waiting for your weekly campaign review, AI provides recommendations for micro-adjustments throughout the day to maintain optimal performance.
One of the biggest advantages is automated creative rotation based on benchmark performance. When your ad creative starts showing fatigue (CTR drops 20% below benchmark), AI systems can automatically introduce new variations to maintain performance levels.
AI can recommend budget shifts from underperforming campaigns to those exceeding benchmarks, maximizing your overall account performance with reduced manual oversight.
Madgicx's AI Marketer takes this a step further by providing daily account audits that compare your performance against industry benchmarks and offer one-click optimization recommendations. It provides expert-level recommendations with reduced manual oversight.
Pro Tip: AI-powered Meta ads deliver 22% higher returns than average Meta ads, primarily because AI can detect performance drops before they become significant problems through continuous real-time monitoring.
If you're using the same meta ads benchmarking year-round, you're missing massive opportunities. E-commerce performance fluctuates dramatically based on seasonal trends, and understanding these variations can be the difference between profitable scaling and budget waste.
Expect significant cost increases during peak holiday season. CPCs can increase 30-35% and CPMs can surge 25-66% during the holiday shopping season. While costs rise substantially, this period represents over 30% of total annual ecommerce revenue, making it a critical investment period despite higher acquisition costs.
Electronics, fashion, and beauty brands typically see peak performance during back-to-school season, with campaigns usually reaching optimal performance between late July and early September. This represents a key opportunity window for relevant verticals.
The period following holidays shows typical retail downturn patterns, with consumers focused on paying down debt and rebuilding savings. However, ecommerce often sees increased activity as consumers seek convenience and deals during this recovery period.
Plan for significantly higher costs (25-66% increases) during Q4 peak periods while capitalizing on the substantial revenue opportunity this season represents for most ecommerce businesses.
For more insights on how to leverage seasonal trends in your competitive analysis, explore our guide on competitive benchmarking AI.
Here's the step-by-step framework we use to analyze benchmark performance and make scaling decisions:
Compare your current performance against industry-specific benchmarks, not platform-wide averages. Document your CTR, CPC, CPM, and conversion rates for each campaign type and audience segment.
Campaigns performing 50% below industry benchmarks need immediate attention. Those within 10-20% of benchmarks typically just need creative refresh or minor targeting adjustments.
For underperforming campaigns, test new creative angles, adjust targeting parameters, or modify bidding strategies. For top performers, gradually increase budgets while monitoring performance maintenance.
Track performance changes weekly, adjusting your approach based on benchmark comparisons. Successful campaigns should maintain performance within 10% of peak levels as you scale.
Increase budgets by 20-30% every 3-4 days for campaigns consistently exceeding benchmarks. This gradual approach prevents performance drops that often occur with aggressive scaling.
Pro Tip: Scale campaigns performing 20% above industry benchmarks, optimize those within 20% of benchmarks, and pause anything 50% below benchmarks that doesn't improve within one week.
To optimize your budget allocation based on this framework, check out our comprehensive guide on ad spend intelligence.
After analyzing thousands of e-commerce accounts, we've identified the most common meta ads benchmarking mistakes that cost businesses serious money:
Comparing your fashion brand to B2B software companies is like comparing apples to submarines. Always use industry-specific benchmarks for meaningful analysis.
A 1% CTR to a highly qualified, purchase-ready audience is often more valuable than a 3% CTR to unqualified traffic. Factor in conversion rates and customer lifetime value when evaluating performance.
Many advertisers panic when performance drops below benchmarks without considering creative fatigue. Ad creative typically needs refreshing every 7-14 days to maintain optimal performance.
Using January benchmarks to evaluate December performance will lead to poor decisions. Adjust expectations based on seasonal trends in your industry.
Performance fluctuations are normal. Don't pause campaigns immediately when they dip below benchmarks – analyze the cause first and give optimization strategies time to work.
Mobile and desktop performance can vary significantly. Analyze benchmarks separately for each placement to optimize effectively.
Pro Tip: Refresh your ad creative every 7-14 days to maintain benchmark performance. Creative fatigue is often the culprit when previously successful campaigns start underperforming.
For e-commerce, aim for 1.5-2.5% CTR depending on your industry. Fashion typically sees higher CTRs (2.64%) while electronics average 1.91%. Focus on beating your industry median rather than platform averages. Remember, a "good" CTR also depends on your conversion rates and customer lifetime value.
Weekly monitoring is ideal for active campaigns. Daily checks can lead to overreaction to normal fluctuations, while monthly reviews miss optimization opportunities. Use automated tools like Madgicx's AI Marketer for continuous benchmark tracking and optimization recommendations without the manual workload.
Higher costs often indicate audience overlap, creative fatigue, or targeting inefficiencies. Other common causes include bidding too aggressively, targeting overly competitive keywords, or running ads during peak competition periods. AI optimization tools can identify and help address these issues, which may reduce costs by 40%.
Not immediately. Analyze the performance gap first – campaigns 50% below benchmarks need immediate optimization, while 10-20% gaps may just need creative refresh or audience adjustments. Give optimization strategies 3-5 days to show results before making drastic changes.
Seasonal trends have a major impact on e-commerce benchmarks. During Q4, expect CPCs to rise by 30–35% while conversion rates also notably improve, as holiday shopping boosts purchase intent. Summer months usually bring softer results and lower CTRs for many verticals, while the back-to-school season (August–September) brings opportunities for electronics, fashion, and beauty verticals, with campaigns typically reaching peak performance between late July and early September as parents and students make targeted purchases for the school year.
Median benchmarks represent the middle point of all campaigns, while averages can be skewed by extremely high or low performers. For practical optimization decisions, median benchmarks provide more realistic performance expectations for typical campaigns.
Understanding meta ads benchmarking isn't just about knowing numbers – it's about using those numbers to make smarter decisions that drive profitable growth. The key takeaways that'll transform your advertising performance: industry-specific benchmarks provide crucial context for optimization decisions, AI-powered tools are designed to improve returns through automated benchmark monitoring, lead generation campaigns consistently outperform traffic campaigns with 61% higher CTRs, and seasonal adjustments are absolutely critical for e-commerce success.
But here's the thing – knowing these benchmarks is only half the battle. The real magic happens when you implement systematic optimization based on benchmark analysis, and that's where most e-commerce businesses struggle with the manual workload.
Start by auditing your current performance against these industry-specific benchmarks, then implement AI-powered optimization to bridge any gaps with streamlined processes. Madgicx's platform makes this entire process more efficient, letting you focus on scaling profitable campaigns instead of drowning in manual analysis and optimization tasks.
Reduce guesswork in your ad performance. Madgicx's AI Marketer provides recommendations based on benchmark analysis and streamlines optimization tasks, helping e-commerce brands improve their advertising performance.
.avif)
Digital copywriter with a passion for sculpting words that resonate in a digital age.