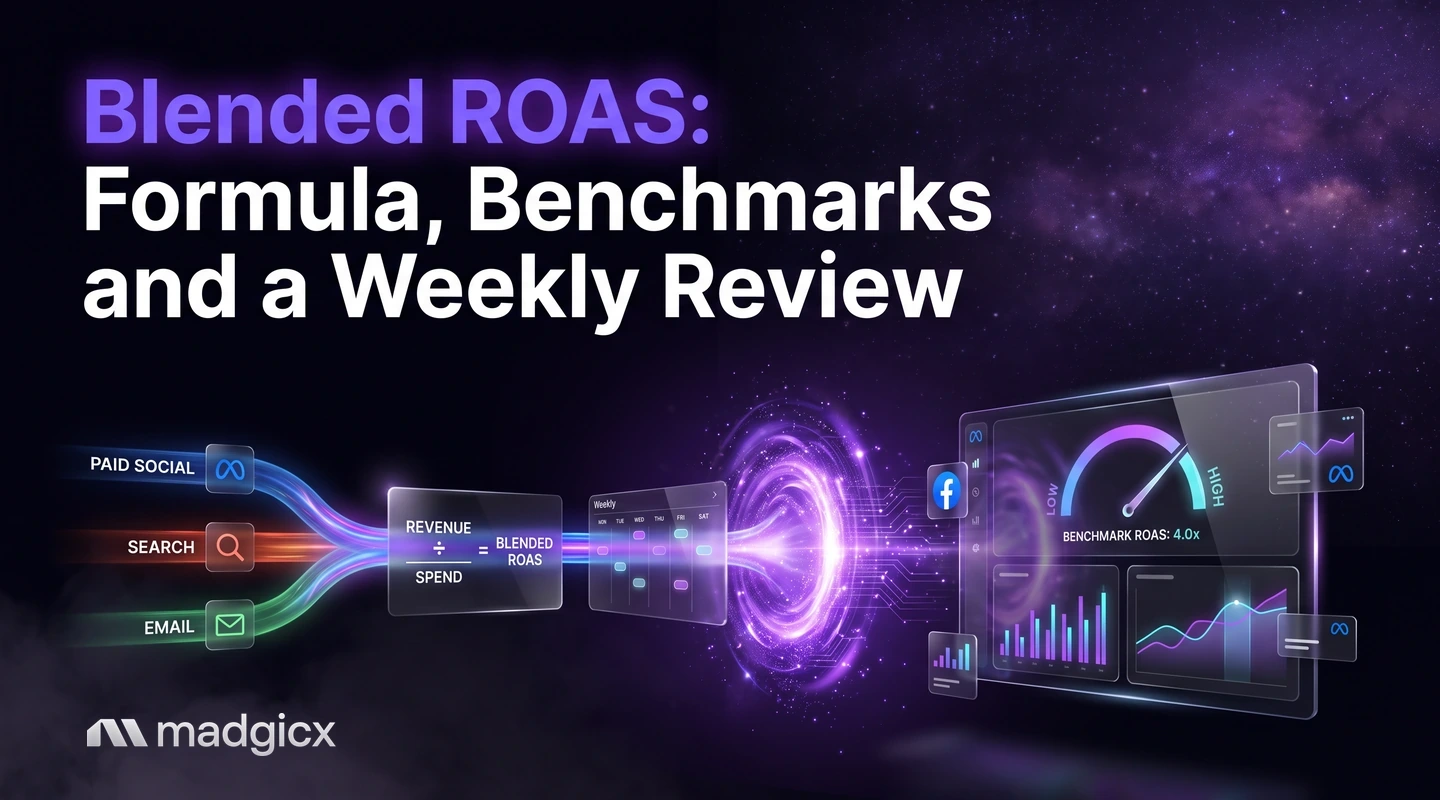
Blended ROAS is total revenue over total ad spend. Get the formula, a break-even target from your margin, where to pull the inputs and a 15-minute weekly routine.
Blended ROAS is your total revenue divided by your total ad spend across every channel, for the same period. If you made $100,000 in store revenue and spent $25,000 on ads across Meta, Google and TikTok, your blended ROAS is 4.0.
It is the honest number when Meta shows one ROAS and your store shows another. Meta's figure counts only the sales it credits to its ads. Blended ROAS looks at the whole business, so it answers a simpler question: for every dollar I spent on ads, how many dollars came into the store?
The Business Dashboard shows blended metrics next to your ad data.
What blended ROAS is and why Meta's ROAS differs
Channel ROAS, such as the ROAS in Ads Manager, divides the conversion value a platform attributes to its own ads by what you spent on that platform. Each platform counts in its own way, so adding them up can credit one sale to two channels, or miss a sale none of them could see.
Blended ROAS avoids the argument. It takes the revenue your store or accounting system recorded and divides it by all the ad spend, so every order counts once. That is why it is the number to put next to your margin and your budget, and why it often looks different from any single channel's report.
It does not tell you which channel or ad deserves credit. Use channel ROAS for that, and blended ROAS to judge the business.
The formula with a worked example
Blended ROAS = total revenue / total ad spend
Use the same date range for both numbers. Here is a week for a store that sells on its own site (the figures are made up for illustration).
| Input | Amount |
|---|---|
| Store revenue, last 7 days | $42,000 |
| Meta ad spend | $7,500 |
| Google ad spend | $2,000 |
| TikTok ad spend | $1,000 |
| Total ad spend | $10,500 |
| Blended ROAS | $42,000 / $10,500 = 4.0 |
Now suppose Meta reports a ROAS of 3.2 for the same week. That is $24,000 of conversion value on $7,500 of spend. Blended ROAS of 4.0 is higher because the store also got sales from email, returning customers and search that no single ad platform claims. Neither number is wrong. They answer different questions.
For the basics of the metric itself, see our guide to how to calculate ROAS.
Blended ROAS vs channel ROAS vs MER
| Metric | Formula | Best used for |
|---|---|---|
| Channel ROAS | Revenue the platform credits / spend on that platform | Comparing ads, ad sets and campaigns inside one platform |
| Blended ROAS | Total store revenue / total ad spend | Judging whether paid ads as a whole pay for themselves |
| MER (marketing efficiency ratio) | Total revenue / total marketing spend | Judging all marketing, including agency fees and tools |
The only difference between blended ROAS and MER is the spend you divide by. Blended ROAS uses ad spend alone. MER uses all marketing spend. Pick one definition and keep it, so the trend means something. Our guide to the marketing efficiency ratio covers MER in more detail, and our comparison of ROAS vs ROI explains when each is the right measure.
Setting a target from your margin
A good blended ROAS depends on your margin, not on a universal benchmark. The break-even point is the ROAS at which ad spend equals the gross profit on the revenue.
Break-even blended ROAS = 1 / gross margin
Use the margin after product cost, shipping and payment fees, before ad spend.
| Gross margin | Break-even ROAS | What it means |
|---|---|---|
| 25% | 4.0 | You need $4 of revenue per $1 of ads to break even |
| 40% | 2.5 | You break even at $2.50 per $1 |
| 50% | 2.0 | You break even at $2 per $1 |
| 70% | 1.43 | You break even at about $1.43 per $1 |
Worked example: a 40% margin gives a break-even ROAS of 2.5. At the 4.0 blended ROAS above, each $1 of ads brings $4 of revenue and $1.60 of gross profit, so $0.60 is left after the ad dollar. Set your target above break-even. How far above depends on your other costs and growth goals; many brands add a cushion for overhead.
You can run the numbers for your own margin with the break-even ROAS calculator, and see how targets work inside campaigns in the glossary entry on ROAS target.
Public blended ROAS benchmarks are scarce and vary with margin, price and repeat purchases, so your own break-even is a better target than an industry average.
How to pull blended numbers from Meta, Google and your store
- Pick one date range and use it everywhere, such as Monday to Sunday.
- Revenue: take total sales from your store or accounting system, not from an ad platform. Decide once whether it is before or after refunds and taxes, and keep to it.
- Meta spend: in Meta's Ads Reporting, check the ad account (top left) and the date range (top right) first. A time breakdown by day or week gives you spend per period.
- Other channel spend: pull spend from Google Ads, TikTok and any other paid channel for the same dates.
- Add the spend, divide revenue by it and record the result in a sheet with one row per week.
When Meta and your store disagree on the number of sales, that gap is normal. Use the store's number for blended ROAS and Meta's for judging ads inside Meta. If the gap grows, check that your conversion tracking still sends events, since Meta can only optimize on the conversions it can see.
Keep the sheet simple: one row per week with revenue, spend by channel, blended ROAS and a note on anything unusual, such as a sale or a stock-out. After a few months the notes explain most of the swings.
A 15-minute weekly review
- Minutes 1 to 3: pull revenue and spend for last week and calculate blended ROAS.
- Minutes 4 to 6: compare it with break-even and with the last four weeks.
- Minutes 7 to 9: if it moved, check which channel's spend changed and whether revenue changed with it.
- Minutes 10 to 12: look at channel ROAS to find the campaigns or ads behind the move.
- Minutes 13 to 15: write one action for the week, such as shifting budget or refreshing a creative.
Judge it over several weeks, not one. A single weak week can be a promotion ending or a delayed purchase, not a trend.
Traps that distort the number
- Mismatched dates: revenue from one week against spend from another.
- Counting refunds inconsistently: pick gross or net revenue and stay with it.
- Leaving out a channel's spend: forgetting a small TikTok or Google budget flatters the ratio.
- Mixing in non-ad revenue: wholesale or retail sales in the revenue figure inflate it.
- Reading one week as a trend: sales lag ad spend for products people think about before buying.
- Mixing blended ROAS and MER: changing the spend definition mid-year breaks the comparison.
See blended numbers in one place with Madgicx
Madgicx's Business Dashboard shows blended business metrics next to Meta, Google Ads, TikTok and Shopify data in one place, so you are not stitching four exports together each week. Madgicx Cloud Tracking sends your conversions to Meta from the server, so Meta sees and attributes more of them. One-Click Report then shares the numbers with a client or teammate by link or PDF.
FAQ
What is blended ROAS?
Blended ROAS is total revenue divided by total ad spend across all channels for the same period. It counts every order once, so it shows whether ads as a whole pay for themselves.
How do you calculate blended ROAS?
Divide total store revenue by the sum of your Meta, Google, TikTok and other ad spend for the same dates. $42,000 of revenue on $10,500 of spend is a blended ROAS of 4.0.
What is the difference between blended ROAS and MER?
Blended ROAS divides revenue by ad spend only. MER divides revenue by all marketing spend, including fees and tools. The revenue side is the same.
What is a good blended ROAS?
One that clears your break-even, which is 1 divided by your gross margin. A 40% margin breaks even at 2.5, so a good target for that business is above 2.5.
Why is my Meta ROAS different from my store's numbers?
Meta counts the sales it credits to its ads, while your store counts every order from every source. Use Meta's ROAS to compare ads and blended ROAS to judge the business.
How often should I check blended ROAS?
Weekly, over the same days each time, and read it as a trend across several weeks rather than a single week.