Think Your Ad Strategy Still Works in 2023?
Get the most comprehensive guide to building the exact workflow we use to drive kickass ROAS for our customers.


Why should you give a damn about validity when A/B testing? Why can’t you just run fun experiments and apply the learnings?
Well, running an A/B test without thinking about statistical confidence is worse than not running a test at all. False confidence, derived from wrong data, could make you believe that you know what works while you don’t. However, you can’t say whether or not you have found real gold unless you know the stats.
Ever heard of the explore-exploit dilemma? Exploration, in this case, refers to collecting more data and getting every piece of information required to make the best decision. Exploitation, on the other hand, refers to making the best use of the data at hand.
Jeff Bezos, the richest human on the planet, once said, “Most decisions should probably be made with somewhere around 70% of the information you wish you had. If you wait for 90%, in most cases, you’re probably being slow.”
The takeaway: Marketers cannot afford to think as academics do—which is searching for Truth (with a capital T). Our job is to provide the best ROI, and that might mean operating with less certainty than we would like.
Alright, let’s dig a little deeper now.
This topic never gets old. However, this is particularly timely in light of the release of Meta's automated ad products grouped under the name of Meta Advantage. I’d like to inform you that Meta’s AI uses a multi-armed bandit A/B testing method. That’s why validity is the number one question on my mind—and this question should be on your mind, too. To quote Facebook, “Advantage+ shopping campaigns use AI to eliminate the manual steps of ad creation and automate up to 150 creative combinations at once.”
But who has the budget and patience to ensure validity behind these 150 creative combinations? At best, sites like Booking.com would. However, SMEs and regular agencies should forget about it.
So, why does statistical significance not ensure validity? By the way, if you don’t know, statistical significance means that a result is unlikely to be due to pure luck or coincidence. Scientific significance or P-Value answers the questions: “How surprising is this result?” or “How likely is it that my experiment results will say I have a winner when I actually don’t?”
Statistical significance does not tell us the probability that B is better than A. Nor is it telling us the probability that we will make a mistake in selecting B over A. It’s the same statistical phenomenon you experience when tossing a coin: after ten tries, you could very well get heads nine times and tails only once, just by chance. In that case, you would get an indication that your test is 99% statistically significant. However, with just ten tries, it doesn’t mean anything.
You may have heard, “Half the money I spend on advertising is wasted; the trouble is I don’t know which half?” Well, this quote is many decades old, and it’s kind of obsolete today.
This convention also provides a standard for academics to report their results. Terms like “these results are significant” and “these results are not significant” are used to make reports easier to understand.
Misunderstanding the meaning of a “significant test result” makes people give way more importance to “significant” results than they deserve. Sometimes, “significance” is even interpreted as a mathematical proof, making considering further evidence unnecessary. Furthermore, it helps executives hide behind "science" to justify their poor decisions.
So, there’s one thing you should never forget: Data is subjective, not objective. That’s why when someone shows you data, you should always ask what method was used to acquire it.
If you run an ad agency, chances are, you may have run dozens of A/B tests over the course of a year and had many wins. Some tests could get you a 25% uplift in revenue or even higher. Yet when you roll out the change, the revenue does not increase by 25%. And 12 months after running all those tests, the conversion rate is still pretty much the same. Do you know why? It’s because your uplifts were not real—they were just a figment of your imagination.
Now that you understand how statistical significance doesn’t necessarily validate an A/B test let’s discuss some rules that should be followed to ensure the validity of the two variants. Once you learn this, you’ll be able to use A/B tests correctly and give your clients the most bang for their buck.
One of the biggest mistakes I have seen advertisers make while running A/B tests is that they start without having a properly defined hypothesis.
It’s a rookie mistake that you should avoid at all costs. You see, building a hypothesis will allow you to think more deeply about the problem. More importantly, you can always either validate or invalidate your theory. By doing so, you learn how to think like a problem solver, and it will be easier for you to come up with further potential solutions.
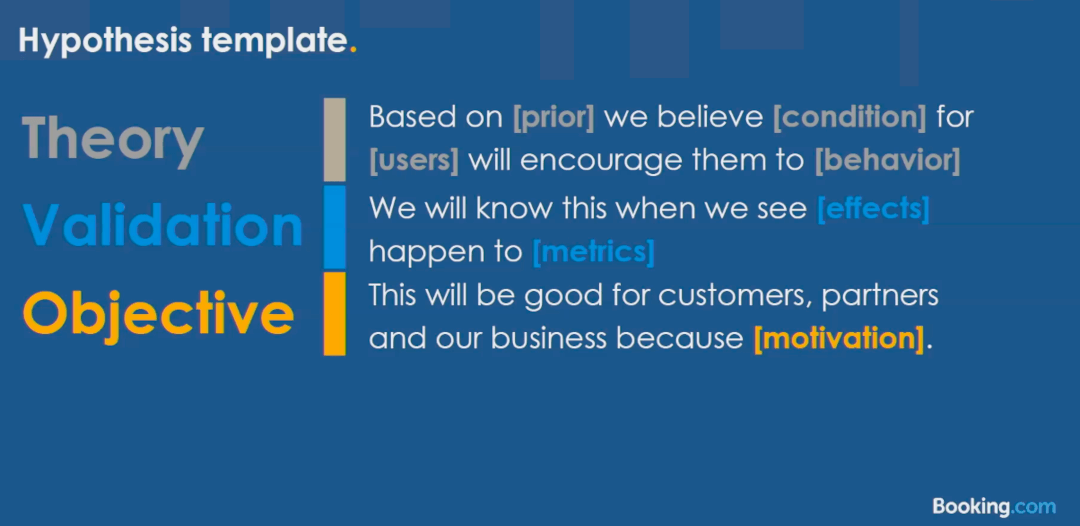
I’d recommend using the Booking.com hypothesis template:
Please, this is my humble request to you: Do not stop your test until you have reached the minimum sample size that will make your test results statistically valid.
First, there is no magical minimum sample size. Sometimes, the right sample size is 100, while other times, it’s 10,000. So, try and think critically. If you have a site that does 100,000 transactions per day, then 100 conversions can’t possibly represent the overall traffic. Don’t waste your time looking for magic numbers—this is science, not magic.
The next factor is the representativeness of your sample. The audience you select in the sample should reflect your usual traffic to ensure that it behaves just as your real buyers would. It’s crucial that you do this and avoid being a victim of the selection effect in which you wrongly assume that some portion of the traffic represents the totality of the traffic. You might increase conversion for that segment, but don’t confuse that with an increase across segments.
Now the question is: How do you know what minimum sample size you need to use? Well, it is unique to each test and depends on the performance achieved by your winning variation over your control. Basically, the more your tested variation(s) outperform your control version, the smaller your minimum sample size will be.
So, with low traffic, you need bigger wins (bigger uplift or bigger difference between A/B conversion rate) to run a monthly test. In other words, many sites have low traffic and low total monthly transaction count. This means that in order to conclude a test within 30 days, you’ll need a big lift.
You should understand that the MDE (minimum detectable effect) and baseline conversion rate have a negative relationship with sample size. When the baseline conversion rate increases, the sample size decreases. Similarly, when the MDE increases, the sample size decreases.
You must not stop your test before you have run it for at least one full business cycle.
When it comes to testing, ending tests too soon is by far the number one sin.
Now, wait for a second! Let me ensure that you truly understand what I mean by “business cycle.” One of the difficulties with running tests online is that we are not in control of our user cohorts. This can be an issue if the users distribute differently by time and day of the week and even by season. Because of this, you should ensure that you collect your data over all relevant data cycles. Doing so exposes your ads to a more representative sample of the average user population. So, do collect your data on your control, treatment, and optimization variables in order to incorporate the typical traffic patterns.
Now the next question is: How to determine a business cycle? Well, you can easily see your business cycle with any Google Analytics chart set on a 1-month period with daily data points. But, you have to test during both low and high season peaks.
Ideally, your test should run for one or two business cycles so that it includes everything that goes on, including but not limited to the following:
If, as an advertiser, you’re calling off tests at 50%, you should change your profession. Stopping a test mid-cycle wastes your and your client’s time (and money).
Now, what do I mean by mid-cycle? Let’s suppose that your business cycle is 7 days, but you only hit your sample size on the tenth day—what should you do then? Well, in such an event, you should continue the test for an additional 4 days and only stop it after two complete business cycles (instead of stopping it in the middle of a cycle).
Pausing a test mid-cycle could be more problematic than you might think. For instance, in your reporting tool of choice (e.g., Google Analytics), run the “conversions per day of the week” report for your site, and see how much fluctuation there is every day from Monday to Sunday.

The only time you can break this rule is when the daily conversion rate for every single day has been the same, or at least similar, for a very long period. Yes, it literally doesn’t matter if you get 10,000 transactions per day. Even though the absolute number of transactions matters, you also need pure time.
To make things clearer, I’ll show you my personal method. This is the BirkAds 7-step process:
And then repeat this process again.
Do you know that most A/B testing case studies only publish relative increases? You may hear things like, “We got a 20% lift! 30% more signups!” Well, that’s very good, but we also want to know the relative difference.
So, ultimately, can we trust these claims? The truth is: Without knowing the absolute numbers, we can’t. If you have read this article so far, I’d like you to remember this one key takeaway: A/B tests are our tuition, and that’s the fee we have to pay in order to learn. A failure is not a failure; it’s a blessing—something to learn from and then improve the quality and results of tests in the future.
Remember, you cannot explain human behavior by using Newton's physics. It’s not that simple.
A/B testing is great, but not everyone can spend months and thousands of dollars before knowing what works. Madgicx lets you conduct hundreds of tests at once, analyze performance quickly, and achieve your target ROAS faster.

Following his passion for outdoor adventures, Madis founded BirkAds - the only agency in Europe that specializes in Optimizing Ads ROI for the Outdoor Industry. He has audited over 3,000 campaigns, conducted over 672 hours of coaching sessions, and managed ads for more than 70 companies worldwide.