

Think Your Ad Strategy Still Works in 2023?
Get the most comprehensive guide to building the exact workflow we use to drive kickass ROAS for our customers.


What do sea captains, astronauts, and CEOs all have in common?
They all have a north star that guides them to where they want to be.
Whether you're using a compass, a lookout tower, or a spreadsheet, knowing how to gauge if you're on the right path to achieve your goals is crucial in making sure you make it to your end destination.
In this article, we're going to dive deep into KPI tracking for businesses. We'll be covering what KPI tracking is, the top 16 KPIs you should be tracking, and how you can automate all of that data tracking to help pave the way to success.
Climb aboard, matey, as we set sail and find the north star KPIs that will show us the way to the revenue treasure chest of our dreams.
A KPI, or Key Performance Indicator, is the business world's version of a report card. Instead of grades in algebra or history, you're concerned about profit margins, customer satisfaction, or employee turnover.
Like the variety of subjects in school, KPIs come in different flavors to reflect the vastness of the business realm.
There are 'high-level' KPIs - these are your "Honor Roll" statistics, revealing the overall health of the business. Imagine metrics like net profit margin (think of it as the "GPA" for your business) or customer retention rates (like your school's popularity contest, but in the business world!).
Then, there are 'low-level' KPIs - the subject-specific grades, if you will. These focus on the performance of individual departments or processes, much like your math or English grade would reflect your aptitude in those areas. For example, a KPI for your customer service team could be the average time it takes to respond to a customer query.
By keeping a keen eye on these KPIs, businesses can get a pulse on their operations, allowing them to adjust, adapt, and ace the test of commercial success.
You might be wondering what the difference between KPIs and metrics is. While both, at their core, are technically just data points, KPIs are what you use to gauge the effectiveness of a particular activity in achieving its objectives.
KPIs are usually tightly linked to strategic company goals (increasing revenue, for example) and are used to assess whether an organization or a project is on track to meet them, while metrics are simply data points you can use to analyze general performance.
There are a few other key differences between the two:
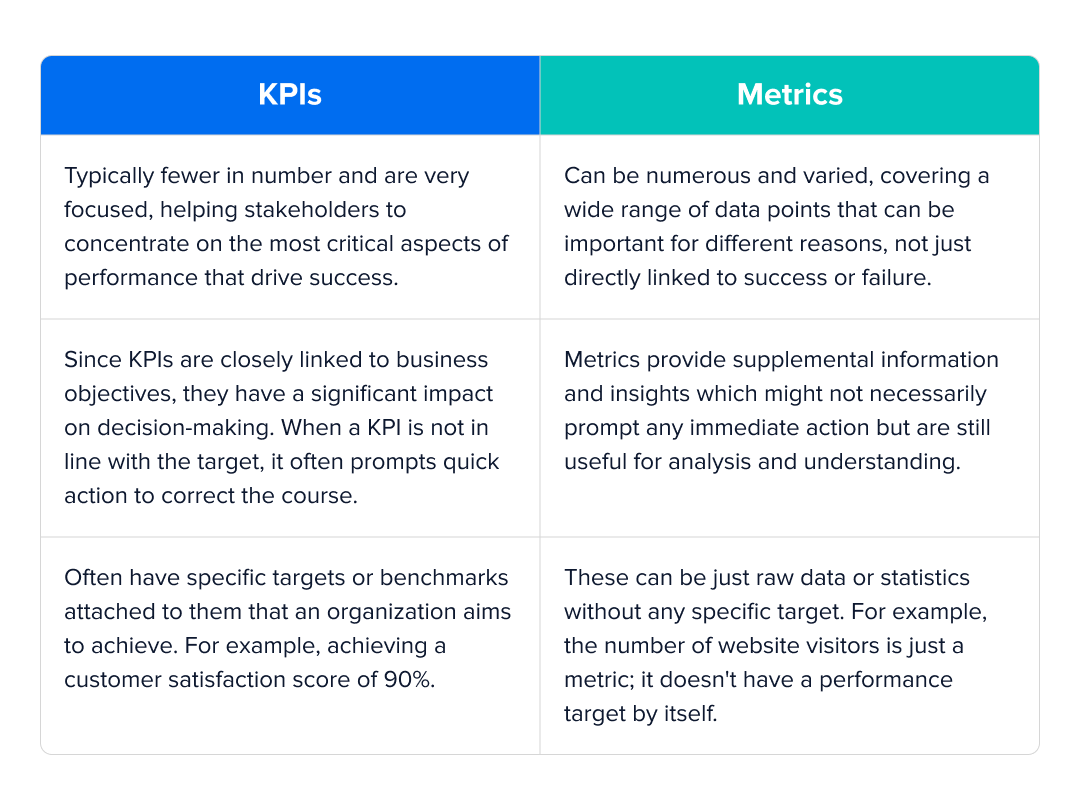
In short, all KPIs are metrics, but not all metrics are KPIs.
Every business, no matter the industry or niche, has one goal: to make enough money to stay in business.
By diligently tracking KPIs, companies can ensure they're on the right path to hitting this goal, or if not, know exactly what they need to change to keep them on course.
That being said, there are a ton of other crucial reasons why KPI tracking is a must in 2023:
Before you dive into the nitty-gritty of KPIs, you need to plot your course by defining your business goals and objectives. It’s time to get crystal clear on what you want to achieve. Are you looking to boost sales, enhance customer satisfaction, or scale operations? Knowing what you're aiming for is the first step.
Now, armed with your objectives, you’re ready for the next phase - selecting relevant KPIs. This step is about choosing the right yardsticks that directly tie into your goals. If you’re aiming to skyrocket your sales, KPIs like gross profit, average order value, and profit margin may be best. Eyeing customer satisfaction? Customer feedback scores are your treasure.
By choosing KPIs that are directly aligned with your goals, you’ll ensure that you’re not just collecting data for the sake of it; you’re gathering insights that are both actionable and meaningful.
At the end of the day, if you find that your KPIs aren't moving the needle in the way you need, don't be afraid to change them. Taking an honest inventory of your business's changing needs and aligning your KPIs to reflect them is an important component in making sure this strategy is helping and not hindering your efforts.
If you're not sure what KPIs you should be using, don't fret. Here's a great intro list of some of the top KPIs to track across marketing, sales, and customer service.
Sales:
Marketing:
Customer Service:
While the KPIs on this list are a great place to get started, the truth is that KPIs vary from business to business. Therefore, it's important to select KPIs that are closely aligned with your business objectives to be able to take advantage of them.
Defining your KPIs is a great step, but you need to actually check in on them in order to make these insights actionable and beneficial.
Here are a few best practices for monitoring and reporting on your KPIs:
Establishing a baseline for KPIs is akin to drawing the starting line in a race. It's about knowing where you stand right now, so you can measure how far you've come.
Here are 4 ways to establish your own baselines and benchmarks for tracking KPIs:
Using these four methods in tandem can give you a well-rounded understanding of both where your business has been and where it should be aiming, allowing you to set informed and realistic benchmarks for your KPIs.
Now that you know why you should be tracking your KPIs and what to pay attention to, it's time to overcome the next hurdle: how to actually track those KPIs.
What you might find is that the data for KPIs across your department live in entirely different tech stacks that have different ways of calculating the same metric. Talk about confusing perspectives.
In this case, most operational experts choose to use KPI tracking tools for a few great reasons:
It streamlines data management. KPI tracking software allows businesses to consolidate and manage all their key performance data in one central location. It eliminates the need for manual data collection and spreadsheet management, making it easier to track and analyze KPIs efficiently.
You can monitor performance in real time. If there's a storm approaching, you need to move quickly to avoid the effects. KPI tracking tools provide instant visibility into key areas and help identify trends, patterns, and anomalies quickly.
It improves accuracy. Manual data entry and calculations are prone to errors, leading to inaccurate reporting. Specialized software automates data collection, calculation, and reporting processes, significantly reducing human errors—ensuring that KPI data is accurate and reliable.
You can customize the look and feel of the reports. Everyone wants a nice chart, but unless you're a designer, it's hard to make one look great without some special tool. KPI tracking software offers customizable dashboards and reports, allowing businesses to visualize their KPI data in a way that suits their specific needs. Customization options enable businesses to focus on the most relevant metrics and present them in a clear and concise manner.
Just like with every other facet of business, there are always specialized tools designed to help solve your problems. When it comes to KPI tracking, however, the Madgicx One-Click Report comes stocked with everything you need to set yourself up for success.
With Madgicx's One-Click Report, you'll have access to a one-stop shop for KPI tracking across Facebook, Google ads, Google Analytics, Shopify, and even TikTok.
Better yet, our legendary Business Dashboard is one of the best places to view some of the hardest-hitting KPIs all in one place by evaluating the financial performance of your business. It does so by analyzing the effectiveness of your advertising expenses across Facebook and Google, revealing your real sales and expenses from Shopify, and ultimately determining your net profit.

In addition to the Business Dashboard, Madgicx also features 18 other pre-built dashboards spanning nearly every facet of your business.

And if you need something custom, that's not a problem either. Each report allows you to edit, delete, and add other modules or data points to give you the KPI dashboard of your dreams.
While you may think getting all these fancy dashboards may come at a steep price, you might be surprised to learn that all these dashboards are available for only included in the Madgicx Pro Complete plan ($45/mo) inside Madgicx.
And that, my friends, is a true treasure chest of epic proportions.
Tracking too many KPIs can muddle the waters and take the focus away from what really matters. It's like trying to juggle too many balls at once - you're bound to drop a few.
When you’re swamped with data, you might find yourself in a state of analysis paralysis, where making decisions becomes a Herculean task because there’s just too much information to process.
Not to mention, with a sea of KPIs, your team might lose sight of primary goals and spread themselves too thin trying to optimize everything. Also, it can be expensive and time-consuming to track and analyze a vast number of KPIs, which can eat into resources that could be better used elsewhere.
The best way to prevent this is to prioritize your KPIs.
Ask yourself what the primary goals for your business are and which KPIs are directly linked to them. Then, think about the stage your business is in. For instance, if you’re a start-up, customer acquisition might be more important than scaling operations.
Finally, keep an ear to the ground. Stay in tune with what’s happening in your industry, and be ready to adapt your KPIs as needed. It’s about quality, not quantity. By honing in on the KPIs that pack the most punch, you’ll steer your business toward clear waters.
When businesses over-rely on quantitative KPIs, they run the risk of missing out on the full picture. Sure, numbers don’t lie, but they don’t always tell the whole story, either.
Quantitative KPIs are fantastic for measuring things in black and white, like sales numbers or website traffic. However, they fall short when it comes to gauging aspects like customer satisfaction, employee morale, or brand perception, which are often more nuanced.
This is where balancing quantitative and qualitative metrics comes into play. While quantitative data is more about the 'what,' qualitative data can tell you the 'why.' For instance, your quantitative data might tell you that sales are down, but without qualitative insights, you might not know that it’s because customers find the checkout process cumbersome or confusing.
Considering employee and customer perspectives is a crucial part of this balance. Engaging with employees through feedback sessions or surveys can provide insights into team morale, areas for internal process improvements, or innovative ideas. Likewise, directly engaging with customers through surveys, reviews, or interviews can shed light on their experiences and preferences.
The blend of both approaches allows for better decision-making and a deeper understanding of both the numbers and the human elements that drive a business’s success.
If your ship is headed for a rock and your lookout is asleep, chances are you're going to risk a crash of epic proportions.
When KPIs are not communicated, team members cannot be actively involved in tracking them or know how to take action to contribute meaningfully to them. This involvement is crucial because those on the front lines often have invaluable insights into how goals can be achieved.
When they are in the loop and understand what the targets are, they can contribute ideas and solutions and put in the necessary effort to reach those targets. Moreover, being involved in KPI tracking can make employees feel more invested in the outcomes, as they see themselves as part of the bigger picture.
Openly communicating KPIs and involving team members in their tracking can foster a sense of ownership, align the team’s efforts with the organization’s goals, and build a culture where transparency is valued. This, in turn, can lead to more innovation, higher levels of engagement, and, ultimately, better performance.
As we learned today, effective KPI tracking is a crucial aspect of business success, allowing organizations to monitor performance, make data-driven decisions, and drive continuous improvement.
By implementing a robust KPI tracking system, businesses can gain valuable insights, align their strategies, and stay on course to achieve their goals in an ever-evolving marketplace.
Optimize your marketing efforts using One-Click Report's real-time data. Harness hundreds of metrics to delve deep into every facet of your business’s performance, hit your KPIs, and make smarter business decisions infinitely faster! 🎯

Tory Wenger is a marketing operations whiz with 10+ years of experience mastering CRM optimization, digital marketing, and event strategy. A certified HubSpot, Facebook, and Google expert, her work has been spotlighted on top platforms like Hootsuite, AdEspresso, and Databox. When she’s not crafting winning strategies, you’ll find her gardening or painting in her home in the Florida panhandle.


